How to Read Satellite Imagery: A Complete Guide to Weather From Space
Master visible, infrared, and water vapor satellite imagery. Learn the science behind each channel and how meteorologists use them to track storms.
The Eye in the Sky
Weather satellites revolutionized forecasting when TIROS-1 launched in 1960, giving meteorologists their first view of Earth's weather systems from space. Today, geostationary satellites provide continuous monitoring of developing storms, hurricanes, and atmospheric patterns that would otherwise go undetected.
Understanding satellite imagery gives you a powerful tool that complements radar—while radar shows precipitation, satellites reveal the entire cloud structure, moisture patterns, and developing weather systems before they produce a single drop of rain.
Meet the GOES Satellites
The United States relies on the GOES (Geostationary Operational Environmental Satellite) system for weather monitoring:
- GOES-19 (GOES-East) at -75.2° longitude - covers the eastern US, Atlantic, and Gulf of Mexico
- GOES-18 (GOES-West) at -137.2° longitude - covers the western US and Pacific Ocean
These satellites orbit at approximately 35,786 km (22,236 miles) above Earth's equator. At this altitude, their orbital period matches Earth's rotation—so they appear to hover over the same spot, providing continuous coverage of the same region.
Each GOES satellite carries the Advanced Baseline Imager (ABI), which scans the Earth in 16 different spectral bands (wavelengths of light). Full disk images update every 10-15 minutes, with mesoscale sectors updating every 1-2 minutes during severe weather.
For the Asia-Pacific region, Himawari-9 at 140.7°E provides similar capabilities using its Advanced Himawari Imager (AHI).
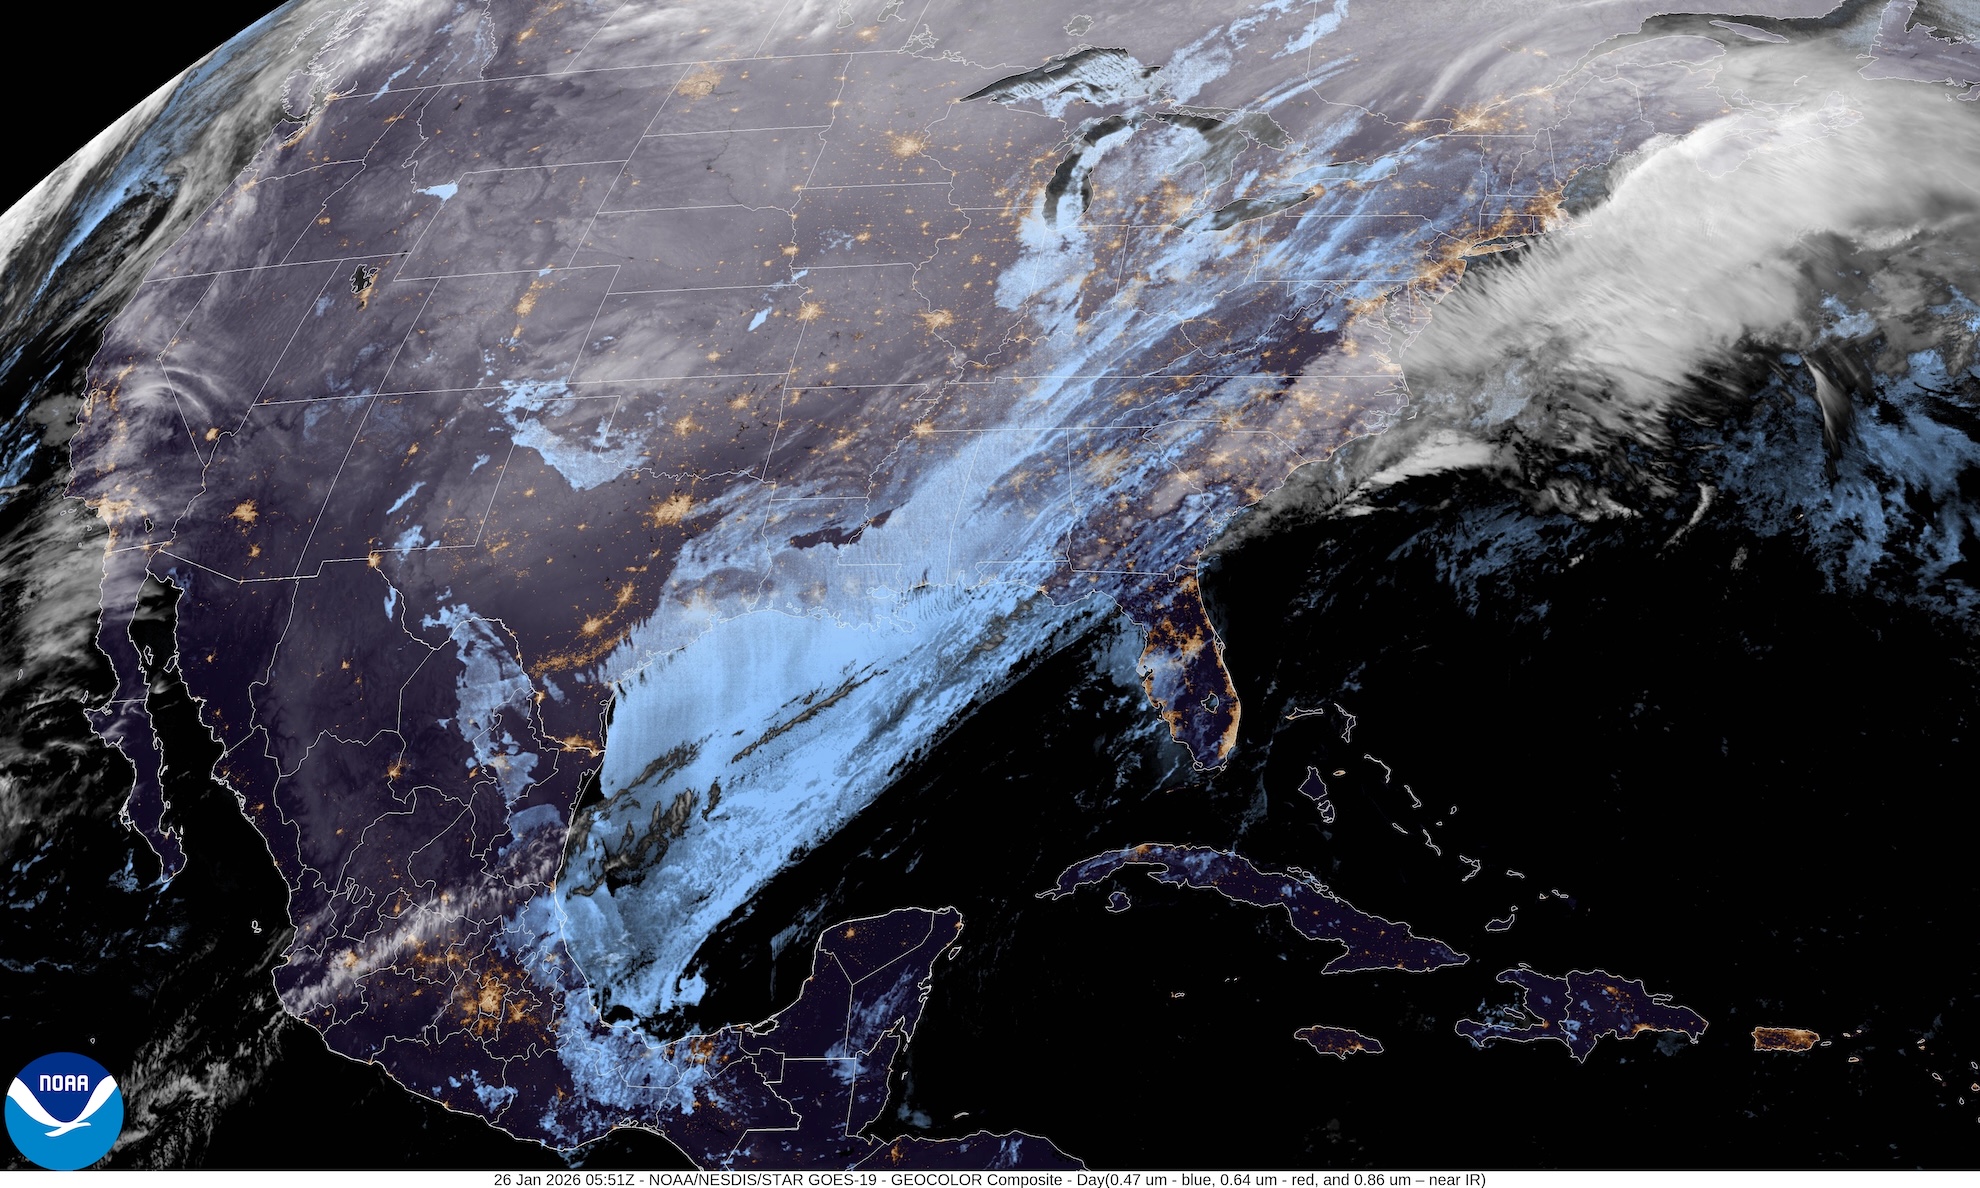 GeoColor imagery combines multiple channels to create a natural-looking view of Earth.
Understanding the Electromagnetic Spectrum
Satellites don't just take photographs—they measure electromagnetic radiation at specific wavelengths that reveal different atmospheric properties:
| Spectrum Region | Wavelength Range | What It Detects |
|---|---|---|
| Visible | 0.4 - 0.7 μm | Reflected sunlight (daytime only) |
| Near-Infrared | 0.7 - 1.4 μm | Vegetation, aerosols, cloud particles |
| Thermal Infrared | 3 - 15 μm | Heat emission (day and night) |
| Water Vapor | 6 - 7.5 μm | Atmospheric moisture content |
Each wavelength provides unique information. Meteorologists combine multiple channels to build a complete picture of developing weather systems.
Visible Channels: Seeing What Your Eyes See
Visible imagery measures sunlight reflected off clouds and Earth's surface—essentially what you'd see looking down from space.
Band 2 - Red Visible (0.64 μm)
This is the primary daytime imagery channel. It measures:
- Albedo (reflectivity) - Thick clouds reflect ~80% of sunlight, appearing bright white
- Cloud texture - Sharp edges indicate active convection; smooth tops suggest stable stratiform clouds
- Surface features - Snow cover, dust plumes, smoke from fires
Best for: Cloud edge detection, fog/stratus identification, severe storm structure
Limitation: Completely useless at night (no sunlight to reflect). If you view visible imagery after sunset, it will appear completely black—this is normal and expected.
Note: The GeoColor image at the top of this article shows what true-color visible imagery looks like during daytime. At night, GeoColor automatically switches to infrared with city lights overlay.
Band 1 - Blue Visible (0.47 μm)
The shorter blue wavelength experiences more atmospheric scattering, making it ideal for:
- Aerosol detection - Smoke, dust, and haze stand out
- Air quality monitoring - Pollution plumes become visible
- Dust storms - Saharan dust over the Atlantic appears prominently
Band 3 - Veggie/NIR (0.86 μm)
Just beyond visible light, the "Veggie" band reveals:
- Vegetation health - Healthy plants reflect near-infrared strongly (appearing bright)
- Burn scars - Fire-damaged areas appear dark
- Water bodies - Water absorbs NIR, appearing very dark
This band is crucial for creating natural-looking true color composite images.
Infrared Channels: Seeing in the Dark
Infrared imagery detects thermal radiation emitted by all objects based on their temperature. This works 24 hours a day—no sunlight required.
The Physics Behind IR
All objects above absolute zero emit electromagnetic radiation according to Planck's law. Warmer objects emit more energy at shorter wavelengths. Satellites measure this emission to determine temperature:
- Warm surface (20°C) → emits more IR → appears dark on standard imagery
- Cold cloud tops (-50°C) → emits less IR → appears bright on standard imagery
This inverted scale takes adjustment—bright pixels mean cold, not reflective.
Band 13 - Clean IR (10.3 μm)
The "clean" longwave infrared window is the workhorse of satellite meteorology:
- Minimal water vapor absorption at this wavelength (hence "clean")
- Directly measures cloud-top temperature
- Works identically day and night
 Infrared imagery reveals cloud-top temperatures. Bright white indicates the coldest (highest) cloud tops, often associated with severe thunderstorms.
Converting Temperature to Altitude
The atmosphere cools with altitude at roughly 6.5°C per kilometer (the environmental lapse rate). This relationship lets us estimate cloud heights:
| Cloud-Top Temperature | Approximate Altitude | Cloud Type |
|---|---|---|
| 0°C to -10°C | 2-4 km | Low/mid-level clouds |
| -30°C to -40°C | 6-8 km | Mid-level thunderstorms |
| -50°C to -60°C | 10-12 km | Mature thunderstorm tops |
| -70°C or colder | 12-15 km | Overshooting tops (severe) |
Overshooting tops penetrate the tropopause into the stratosphere, indicating the strongest updrafts. These storms often produce severe weather including large hail and tornadoes.
Water Vapor Channels: The Invisible Made Visible
Water vapor imagery is perhaps the most underappreciated satellite product. It shows high cloud like any other infrared channel, but its real value is that it also reveals moisture and motion in the mid and upper troposphere in cloud-free air, which no visible image can do.
Here's the mechanism, because it's worth getting right. Water vapor absorbs and re-emits infrared radiation strongly at specific wavelengths. At those wavelengths the satellite cannot see all the way to the ground: the radiation reaching it comes from a broad layer of the atmosphere, described by what's called a weighting function. What the sensor actually measures is a brightness temperature, and where that layer sits depends on how much moisture is present. In moist air the emission comes from higher, colder altitudes and the pixel appears bright; in dry air the satellite sees deeper into warmer air and the pixel appears dark.
That is why water vapor imagery is best read qualitatively. Bright and dark patterns are excellent for tracing jet streaks, upper-level troughs and ridges, and dry-air intrusions. They are not a humidity map: you cannot read a moisture value off a pixel, the layer being sampled shifts with the moisture itself, and temperature, cloud, and viewing angle all shape the brightness.
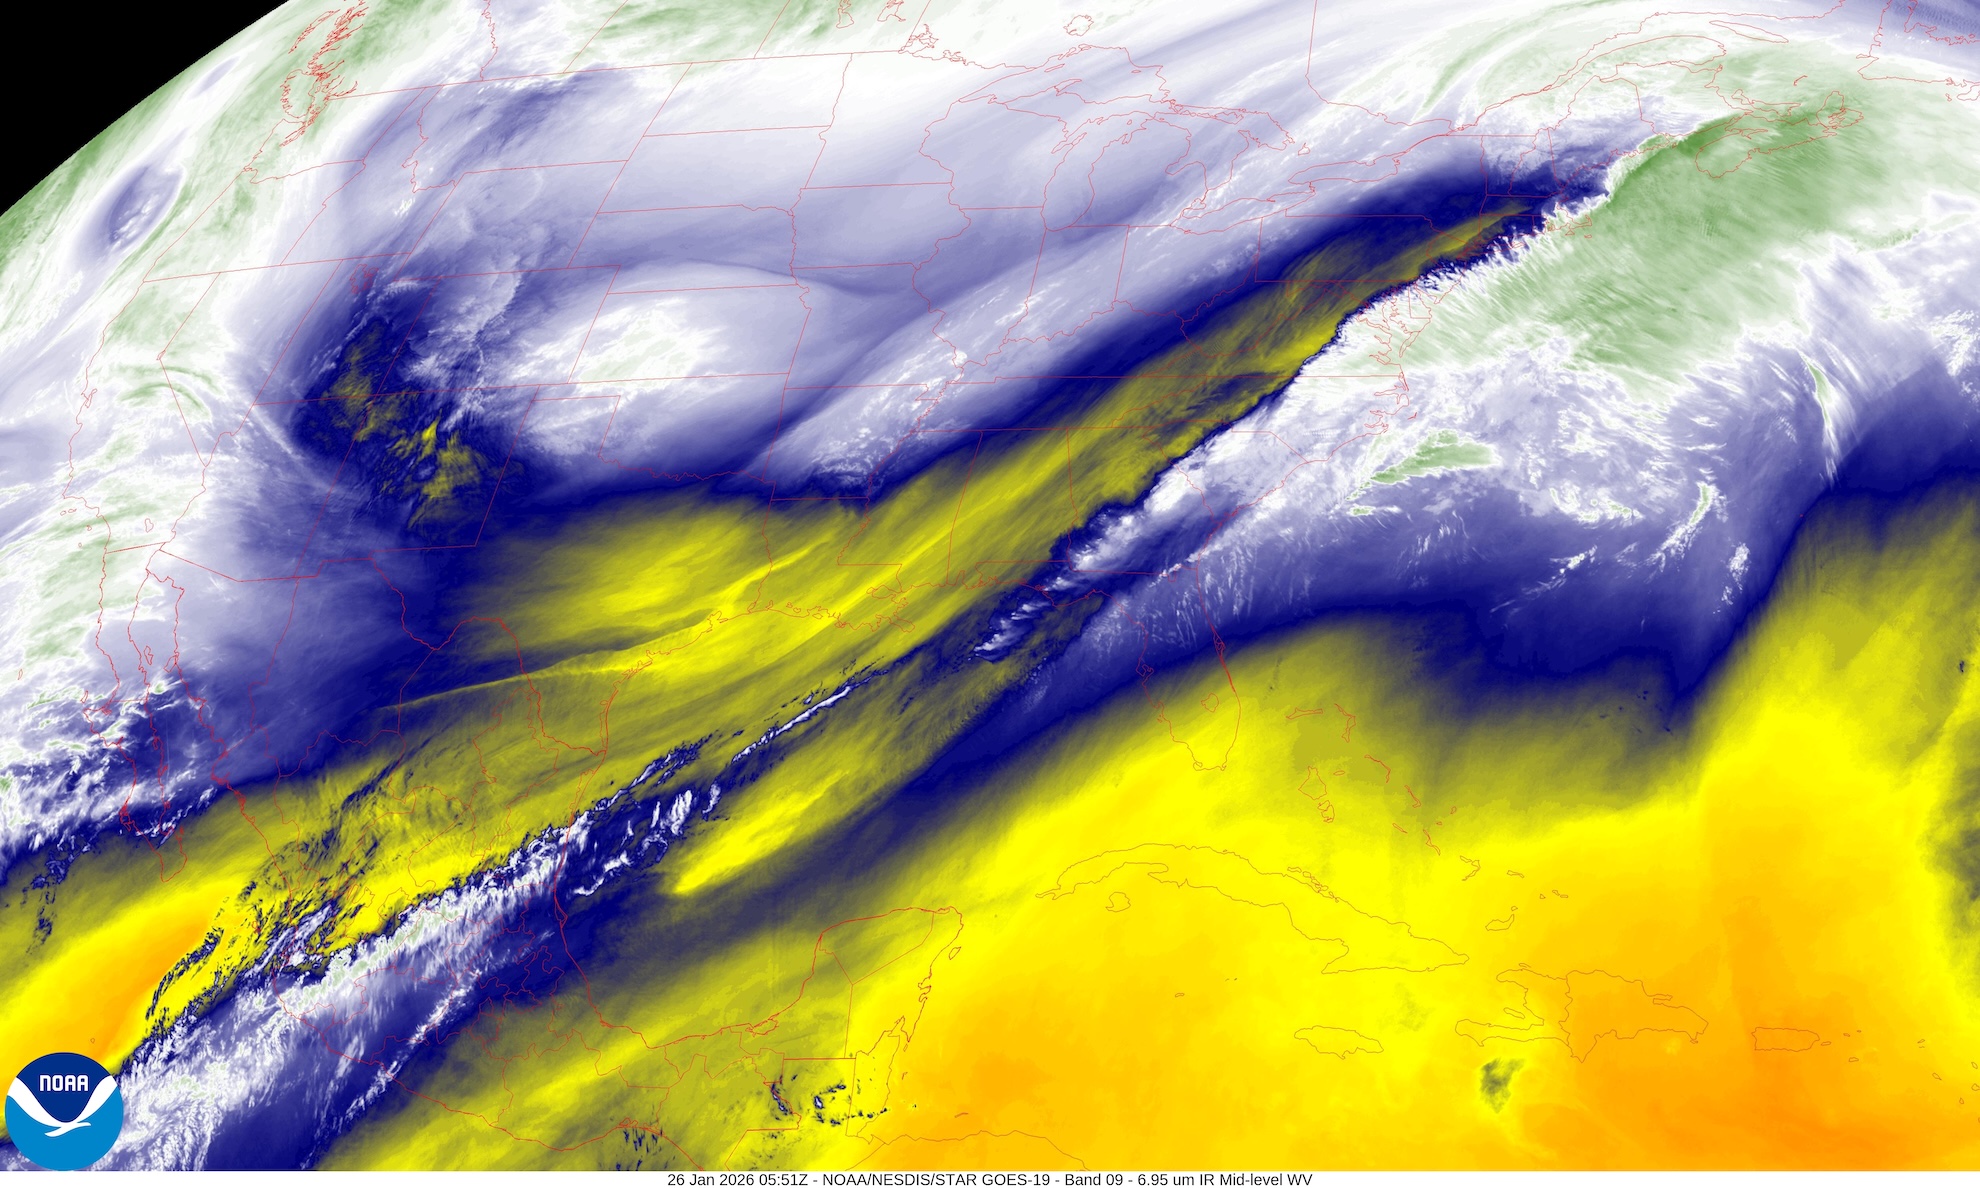 Water vapor imagery reveals moisture patterns invisible to the naked eye. Bright areas indicate a moister upper troposphere; dark regions indicate drier air, often sinking from above.
Band 8 - Upper-Level Water Vapor (6.2 μm)
- Weighted toward 300-500 mb (approximately 6-9 km altitude), though the exact layer shifts with how moist the column is
- Bright areas = moister upper troposphere
- Dark areas = drier air, frequently subsidence from the upper troposphere or lower stratosphere
Band 9 - Mid-Level Water Vapor (6.9 μm)
- Slightly longer wavelength "sees" deeper into the atmosphere
- Shows moisture at 400-600 mb (approximately 5-7 km)
Band 10 - Lower-Level Water Vapor (7.3 μm)
- Penetrates even deeper
- Reveals mid-level moisture patterns
What Water Vapor Reveals
- Jet stream position - Sharp moisture gradients mark the jet's location
- Dry air intrusions - Dark "fingers" of descending air that can cap convection or enhance severe weather
- Atmospheric rivers - Long plumes of moisture feeding precipitation
- Upper-level dynamics - Deformation zones and vorticity patterns
- Developing cyclones - Rotation becomes visible before surface impacts
Pro tip: The sharpest dark/light boundaries in water vapor imagery often coincide with the strongest winds at jet stream level.
Composite Products: Best of All Worlds
GeoColor
The GeoColor product is the most user-friendly satellite imagery available:
- Daytime: True color composite (Bands 1, 2, 3) showing natural appearance
- Nighttime: Infrared imagery with city lights overlay for geographic reference
This hybrid approach provides seamless 24-hour coverage that's intuitive for non-meteorologists.
True Color RGB
Combines visible bands to approximate what the human eye would see from space:
- Natural land and ocean colors
- Smoke and dust appear brownish
- Vegetation appears green
- Snow appears bright white
Requires daytime and careful processing to balance colors accurately.
Identifying Severe Thunderstorms
Satellite imagery excels at spotting severe storm signatures that radar might miss. A word on how to read them, though: these are markers of a strong updraft, and they support expert analysis rather than replacing it. A storm can show a textbook overshooting top and produce nothing at the ground, and a storm can produce a tornado without any of them. Forecasters weigh these signatures alongside radar, environment, and ground reports. None of them, on their own, forecasts hail or a tornado, and none of them substitute for an official warning.
Overshooting Tops
Look for the coldest pixels within a thunderstorm complex. Overshooting tops:
- Appear as small, extremely cold bumps protruding above the anvil
- Can drop to -70°C or colder
- Often correlate with severe weather reports
Enhanced-V Signature
A warm notch downstream of a strong updraft:
- Cold overshooting top followed by warm wake
- Indicates very strong updraft punching through the tropopause
- Associated with severe hail and tornadoes
Above-Anvil Cirrus Plume (AACP)
- Thin cirrus streaming downwind from overshooting top
- Generated by gravity waves from the updraft
- Marker of the most intense convection
Rapid Expansion
Watch satellite loops for storms that expand explosively—doubling anvil size within 15-30 minutes indicates dangerous intensification.
Tropical Cyclone Analysis
Satellite imagery is essential for monitoring hurricanes over the open ocean where radar coverage doesn't exist.
The Dvorak Technique
Developed in the 1970s, this pattern recognition method estimates hurricane intensity from satellite appearance:
- CDO (Central Dense Overcast) organization indicates strengthening
- Eye clarity and temperature correlates with intensity
- Curved band patterns reveal organization level
- Eye temperature vs. eyewall temperature differential estimates wind speeds
What to Look For
| Feature | Significance |
|---|---|
| Clear, warm eye | Intense hurricane |
| Ragged eye | Weakening or eyewall replacement |
| Symmetric appearance | Peak intensity likely |
| Exposed center | Significant shear, weakening |
Fog and Low Cloud Detection
Low clouds and fog are notoriously difficult to see in visible or standard IR imagery. Special techniques help:
Nighttime Fog Detection
The 3.9 μm - 10.3 μm difference product exploits different emission properties:
- Low stratus and fog appear distinctly different from high clouds
- Allows forecasters to track fog development and dissipation overnight
Daytime Fog
Visible imagery shows:
- Smooth texture (unlike lumpy cumulus)
- Sharp edges along coastlines or valleys
- Gradual dissipation as sun heats the ground
Satellite Loops and Animation
Still images only tell part of the story. Animated loops reveal:
- Cloud motion - Wind direction at cloud level
- Development rates - How quickly storms intensify or decay
- Storm rotation - Mesocyclone signatures visible in IR
- Moisture transport - Atmospheric rivers in motion
Viewing Tips
- Loop visible and IR side-by-side for complete understanding
- Focus on the coldest pixels when tracking severe storms
- Watch for rapid changes over 15-30 minute periods
- Note shadows in visible imagery—they indicate cloud height
Limitations and Caveats
Parallax Error
High clouds appear displaced from their true surface position because you're viewing at an angle. The effect worsens:
- Near the edge of the satellite's view
- For very high clouds (displacement increases with altitude)
Viewing Angle Distortion
Features near the edge of the disk appear stretched and distorted. Stick to imagery near your location for best accuracy.
What Satellites Can't See
- Through higher clouds - IR shows the highest cloud top, not layers beneath
- Precipitation - Satellites see cloud tops; radar sees rain falling
- Low-level details - When covered by high cirrus, surface features disappear
Visible Imagery Limitations
- No data at night
- Sun glint over oceans can obscure features
- Shadows from high clouds can hide low features
Satellite Imagery in WeatherAI
WeatherAI Pro includes access to professional-grade satellite imagery:
Coverage:
- GOES-18 and GOES-19 for complete US coverage
- Himawari-9 for Asia-Pacific region
Available Channels:
- Visible - Daytime cloud detail
- Infrared - 24/7 cloud-top temperatures
- Water Vapor - Upper-atmospheric moisture
- GeoColor - Natural-looking day/night composite
Features:
- Smooth animation playback with adjustable speed
- Overlay with radar and lightning for complete analysis
- Same data used by the National Weather Service
- Ask the AI to interpret what you're seeing
Just ask: "What does the satellite show near me?" or "Is that cloud mass going to affect my area?"
Putting It All Together
To become proficient at satellite interpretation:
- Start with GeoColor for intuitive understanding
- Use IR at night and for tracking storm development
- Check water vapor to understand large-scale patterns
- Compare with radar - they complement each other perfectly
- Loop animations to see how systems evolve
Satellite imagery reveals the atmospheric "big picture" that radar simply can't provide. While radar shows you what's falling from clouds, satellites show you the entire storm structure, moisture patterns, and developing systems hours before they impact your location.
Conclusion
Mastering satellite imagery transforms your weather awareness from reactive to proactive. You'll see:
- Storms developing before radar detects precipitation
- Moisture patterns that forecast tomorrow's weather
- Hurricane structure over the open ocean
- Fog and low clouds that affect travel
Combined with radar and WeatherAI's conversational AI, you have the same tools meteorologists use—with plain-English explanations whenever you need them.
Ready to see weather from space?
Download WeatherAI for iPhone →
Satellite imagery courtesy of NOAA/NESDIS. Have questions about what you see? Ask our AI directly in the app, or contact support.
Keep Reading
These articles cover adjacent weather questions, practical explainers, and planning workflows related to this topic.
Weather Education
Spaghetti Models Explained: What Those Tangled Hurricane Lines Actually Mean
Spaghetti models are a tangle of individual forecast tracks, not a forecast. Here is what each line is, what the labels like AVNO and EMX stand for, and how to read the spread instead of the scariest strand.
Weather Education
Typhoon vs Hurricane vs Cyclone: Same Storm, Three Names
A typhoon and a hurricane are the same kind of storm with the same 74 mph threshold. What changes is the ocean basin, the agency, and how the wind is measured. Here is the full naming map.
Weather Education
GFS vs HRRR vs NAM: Which Weather Model Should You Trust?
Learn the differences between GFS, HRRR, NAM, and the Euro model. Understand which forecast model to trust for different situations and how weather enthusiasts can interpret model data.
Useful Next Stops
Jump from the explainer into tools, feature pages, and seasonal hubs that deepen the topic.
Feature
Severe Weather
Follow outlooks, watches, warnings, and storm signals in one severe-weather workflow.
Guide
Weather Radar Colors Explained
Understand what green, yellow, red, and purple radar returns usually mean in real-world storms.
Guide
How to Read Weather Radar
Learn the basics of radar interpretation so you can tell where storms are headed and how intense they may become.
Glossary
Hail
Balls or irregular lumps of ice produced in severe thunderstorms.