How to Read Weather Radar Like a Meteorologist
Master weather radar interpretation with this complete guide. Learn to identify storms, track precipitation, and understand what those colors really mean.
Why Understanding Radar Matters
Whether you're planning a commute, organizing an outdoor event, or tracking severe weather, knowing how to read weather radar can be the difference between getting soaked and staying dry, or worse, between safety and danger.
In this guide, you'll learn exactly what professional meteorologists look for when analyzing radar data.
What Is Weather Radar?
Weather radar works by sending out pulses of electromagnetic energy (radio waves) that bounce off precipitation particles in the atmosphere. When these waves return to the radar station, computers analyze:
- How much energy returned (intensity of precipitation)
- How long it took to return (distance from the radar)
- Changes in frequency (movement and wind speed via Doppler effect)
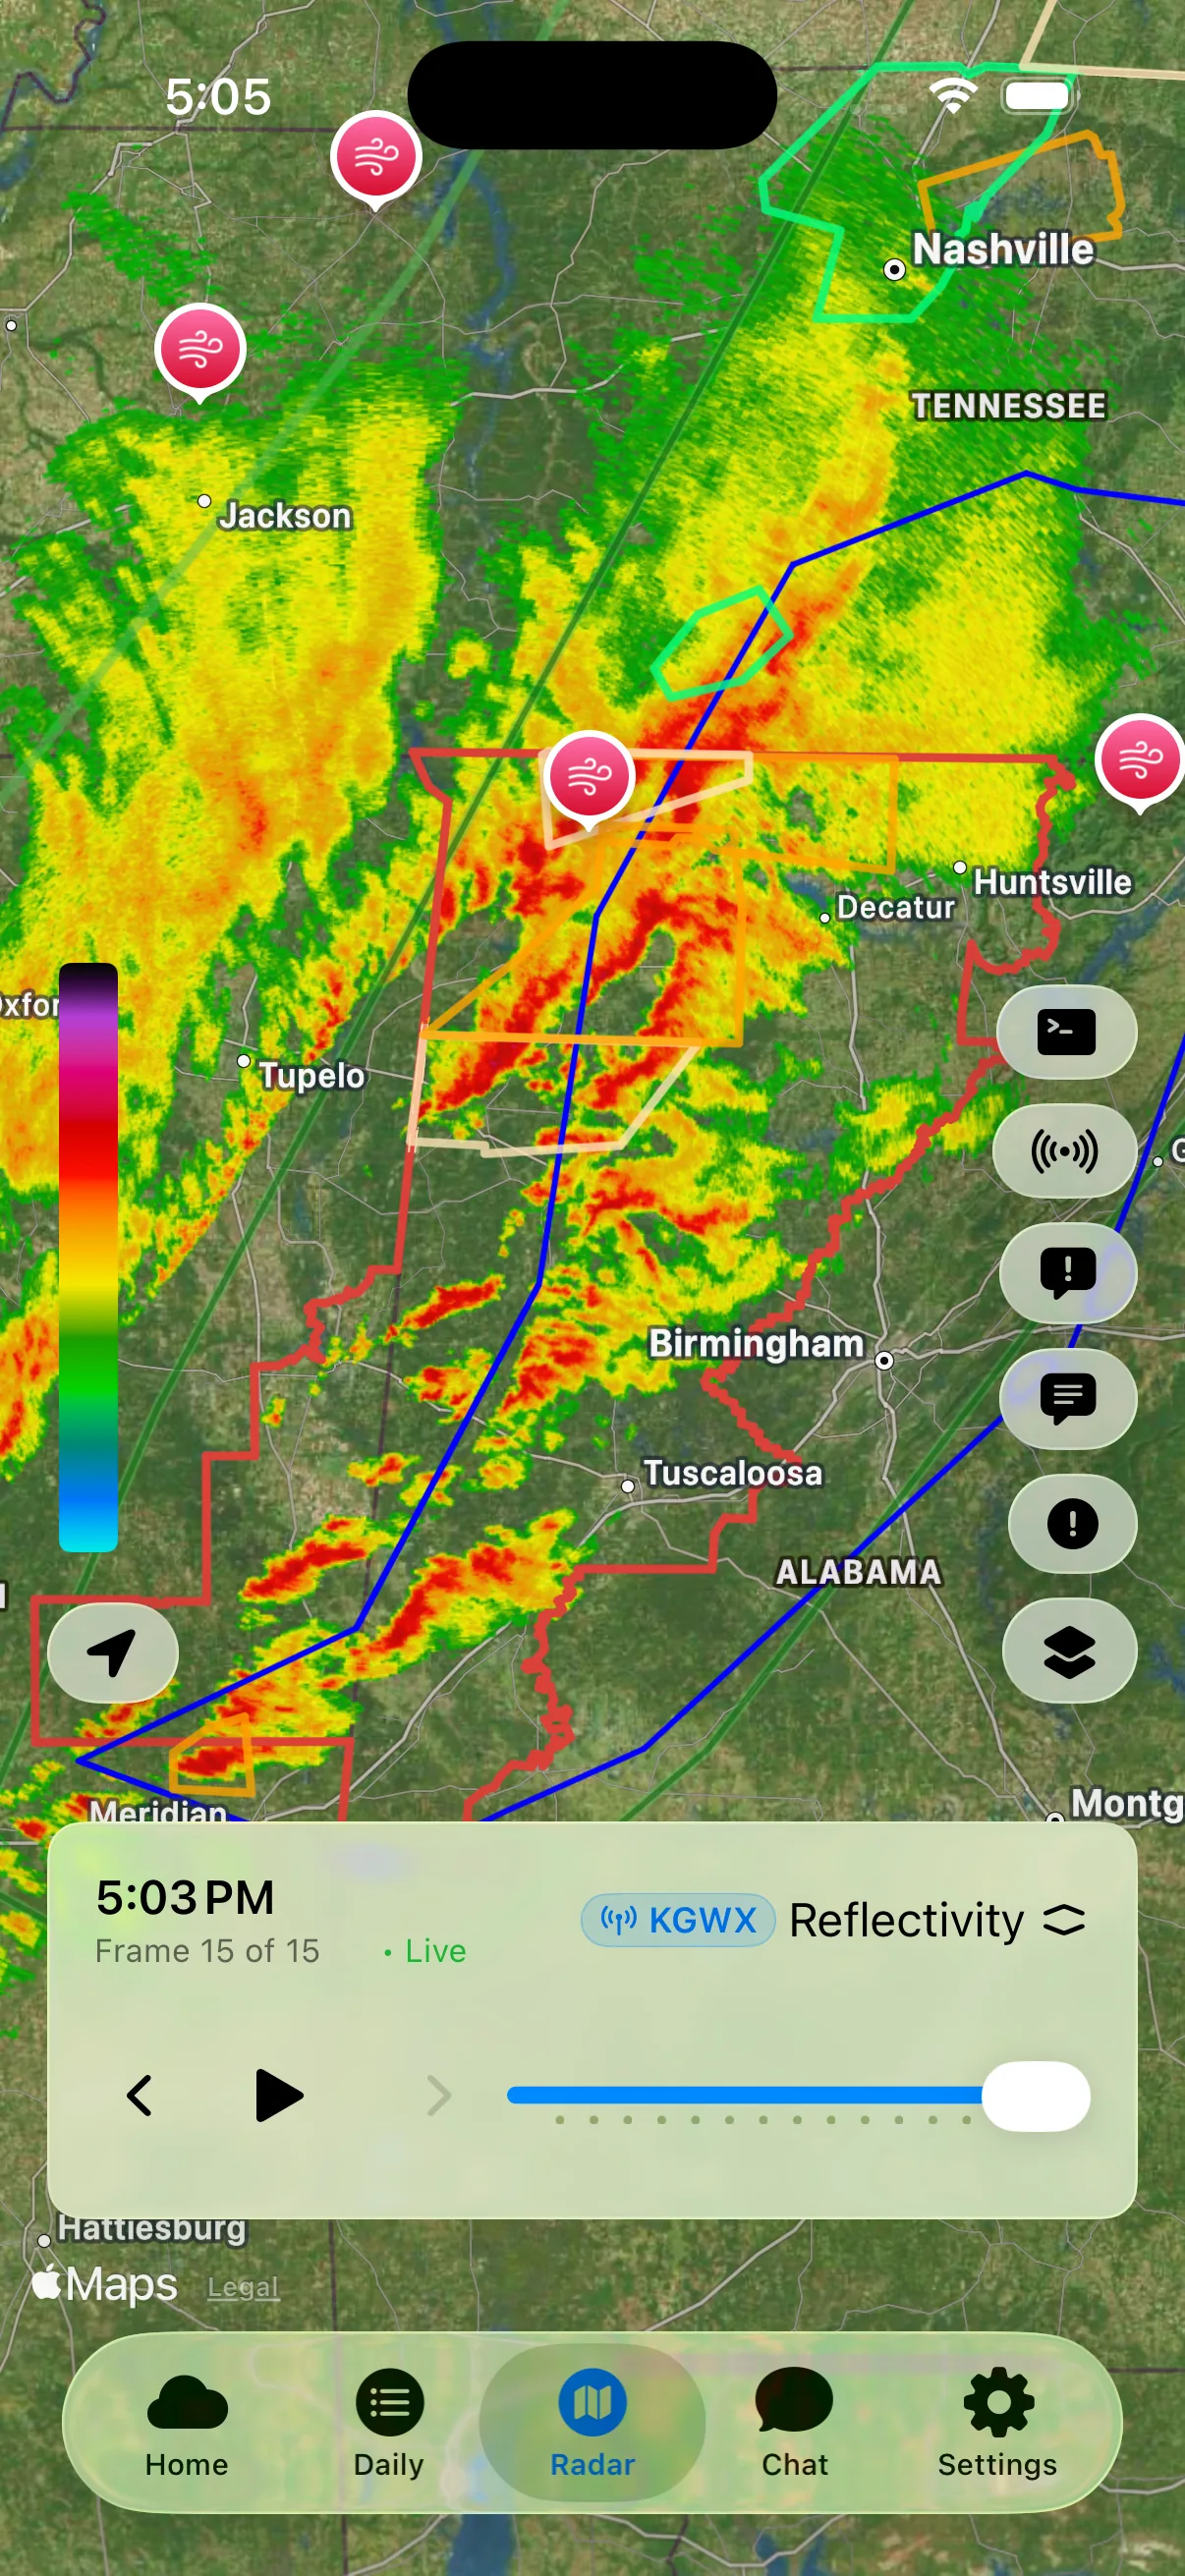
This data creates the colorful radar images you see in weather apps like WeatherAI.
Understanding Radar Colors
The Color Scale: What Each Shade Means
Most radar displays use a color gradient to show precipitation intensity:
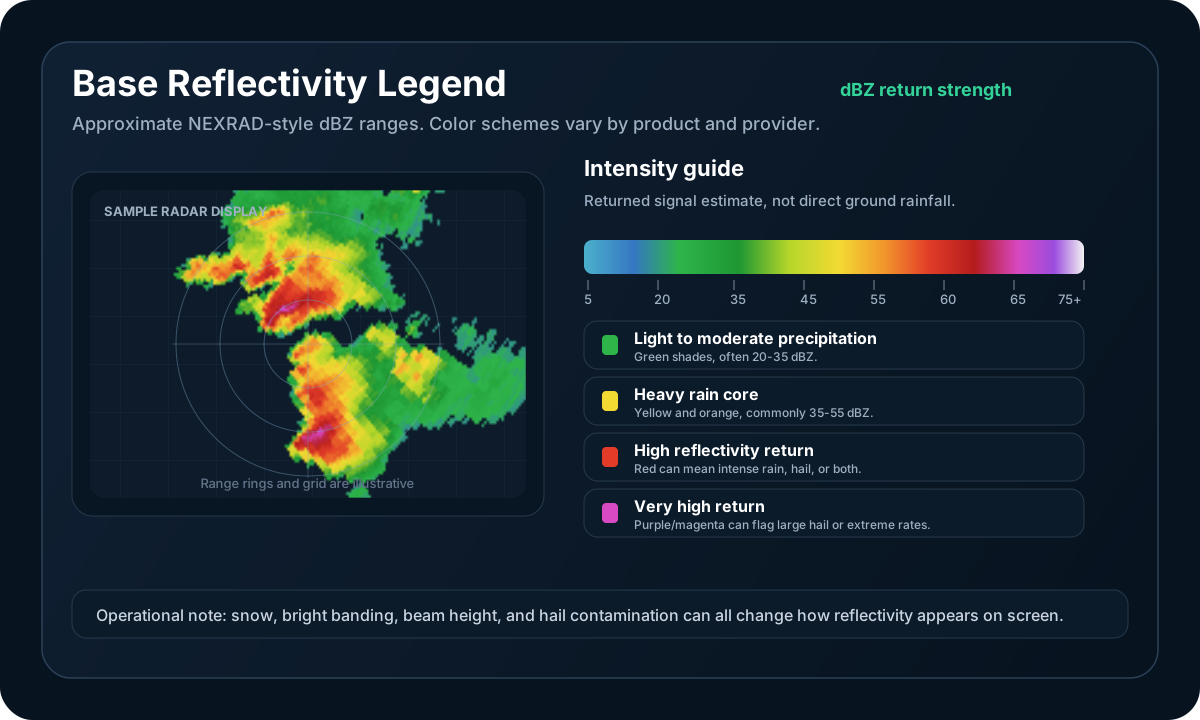
Before the table: check your legend. Radar color schemes are not standardized. Every provider picks its own palette and its own breakpoints, so the same shade of red can mean different things on two apps showing the same storm. The rates below are a rough orientation for a typical scheme, not a universal key.
| Color | Reflectivity | Often corresponds to |
|---|---|---|
| Light Green/Blue | ~5-20 dBZ | Light rain or drizzle |
| Dark Green | ~20-35 dBZ | Light to moderate rain |
| Yellow | ~35-45 dBZ | Moderate to heavy rain |
| Orange | ~45-55 dBZ | Heavy rain |
| Red | ~55-60 dBZ | Very heavy rain, possibly hail |
| Dark Red | ~60-65 dBZ | Intense returns, hail likely |
| Purple/Magenta | ~65+ dBZ | Extreme returns, frequently hail rather than rain |
| Pink/White | Varies | Depends entirely on the product and palette |
Two things that trip people up. First, reflectivity is not rainfall. Radar measures returned energy, which depends on drop size as much as drop quantity, so a few large drops and many small ones can return the same value. Hail returns enormous values while contributing almost no rain, which is why the highest reflectivity often means hail rather than a downpour. Second, the beam is sampling the atmosphere thousands of feet up and rising with distance, so what the radar sees is not necessarily what reaches the ground.
Pro tip: In WeatherAI, you can tap any area of the radar to see the underlying values and storm information for that point.
Reading Radar Patterns
1. Storm Movement: Direction and Speed
To predict where a storm is heading:
- Watch the animation. This is the only reliable method. Track where the cell actually was over the last 30-60 minutes and extend that motion forward
- Don't infer direction from shape. A storm's elongation reflects wind shear and how it formed, not necessarily where it is going. Supercells in particular often deviate to the right of the mean flow, and a line of storms can propagate in a completely different direction from the individual cells within it
- Check the timeline - WeatherAI shows estimated arrival times automatically
Rule of thumb: In North America, weather systems generally move from west to east, but local conditions vary.
2. Storm Structure: What Shapes Mean
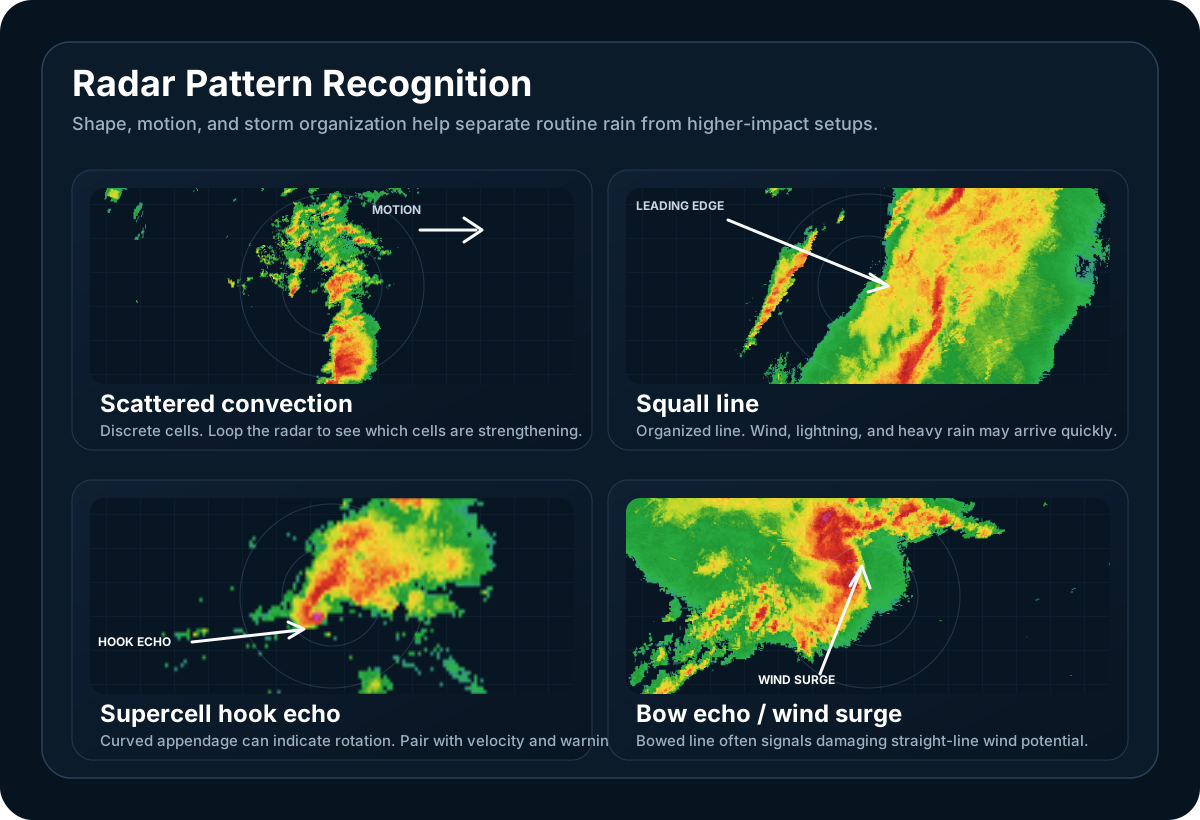
Scattered Showers
- Small, isolated colored patches
- Brief periods of rain
- Low severe weather risk
- Safe to wait out or navigate around
Squall Line
- Long, thin line of storms
- Often moves quickly
- Can produce strong winds and heavy rain
- Passes relatively quickly (30-60 minutes)
Hook Echo ⚠️
- Radar signature shaped like a hook or comma
- DANGER: Possible tornado
- Take shelter immediately if near your location
- Most tornadoes form at the "hook" point
Bow Echo ⚠️
- Curved line of storms resembling an archer's bow
- Indicates severe straight-line winds
- Can produce wind gusts over 70 mph
- Take shelter and secure loose objects
Circular Blob
- Large, amorphous area of precipitation
- Usually indicates widespread rain
- Can last several hours
- Plan for extended wet conditions
3. Precipitation Type Indicators
Modern radar can differentiate between:
- Rain - Green/yellow/orange blobs with smooth edges
- Snow - Light blue/pink, often covering large areas
- Sleet/Freezing rain - Pink or magenta during winter
- Hail - Purple/pink within thunderstorms
WeatherAI's AI can analyze radar patterns and tell you: "Looks like hail is possible in this storm. If you hear thunder, get indoors."
Advanced Radar Features
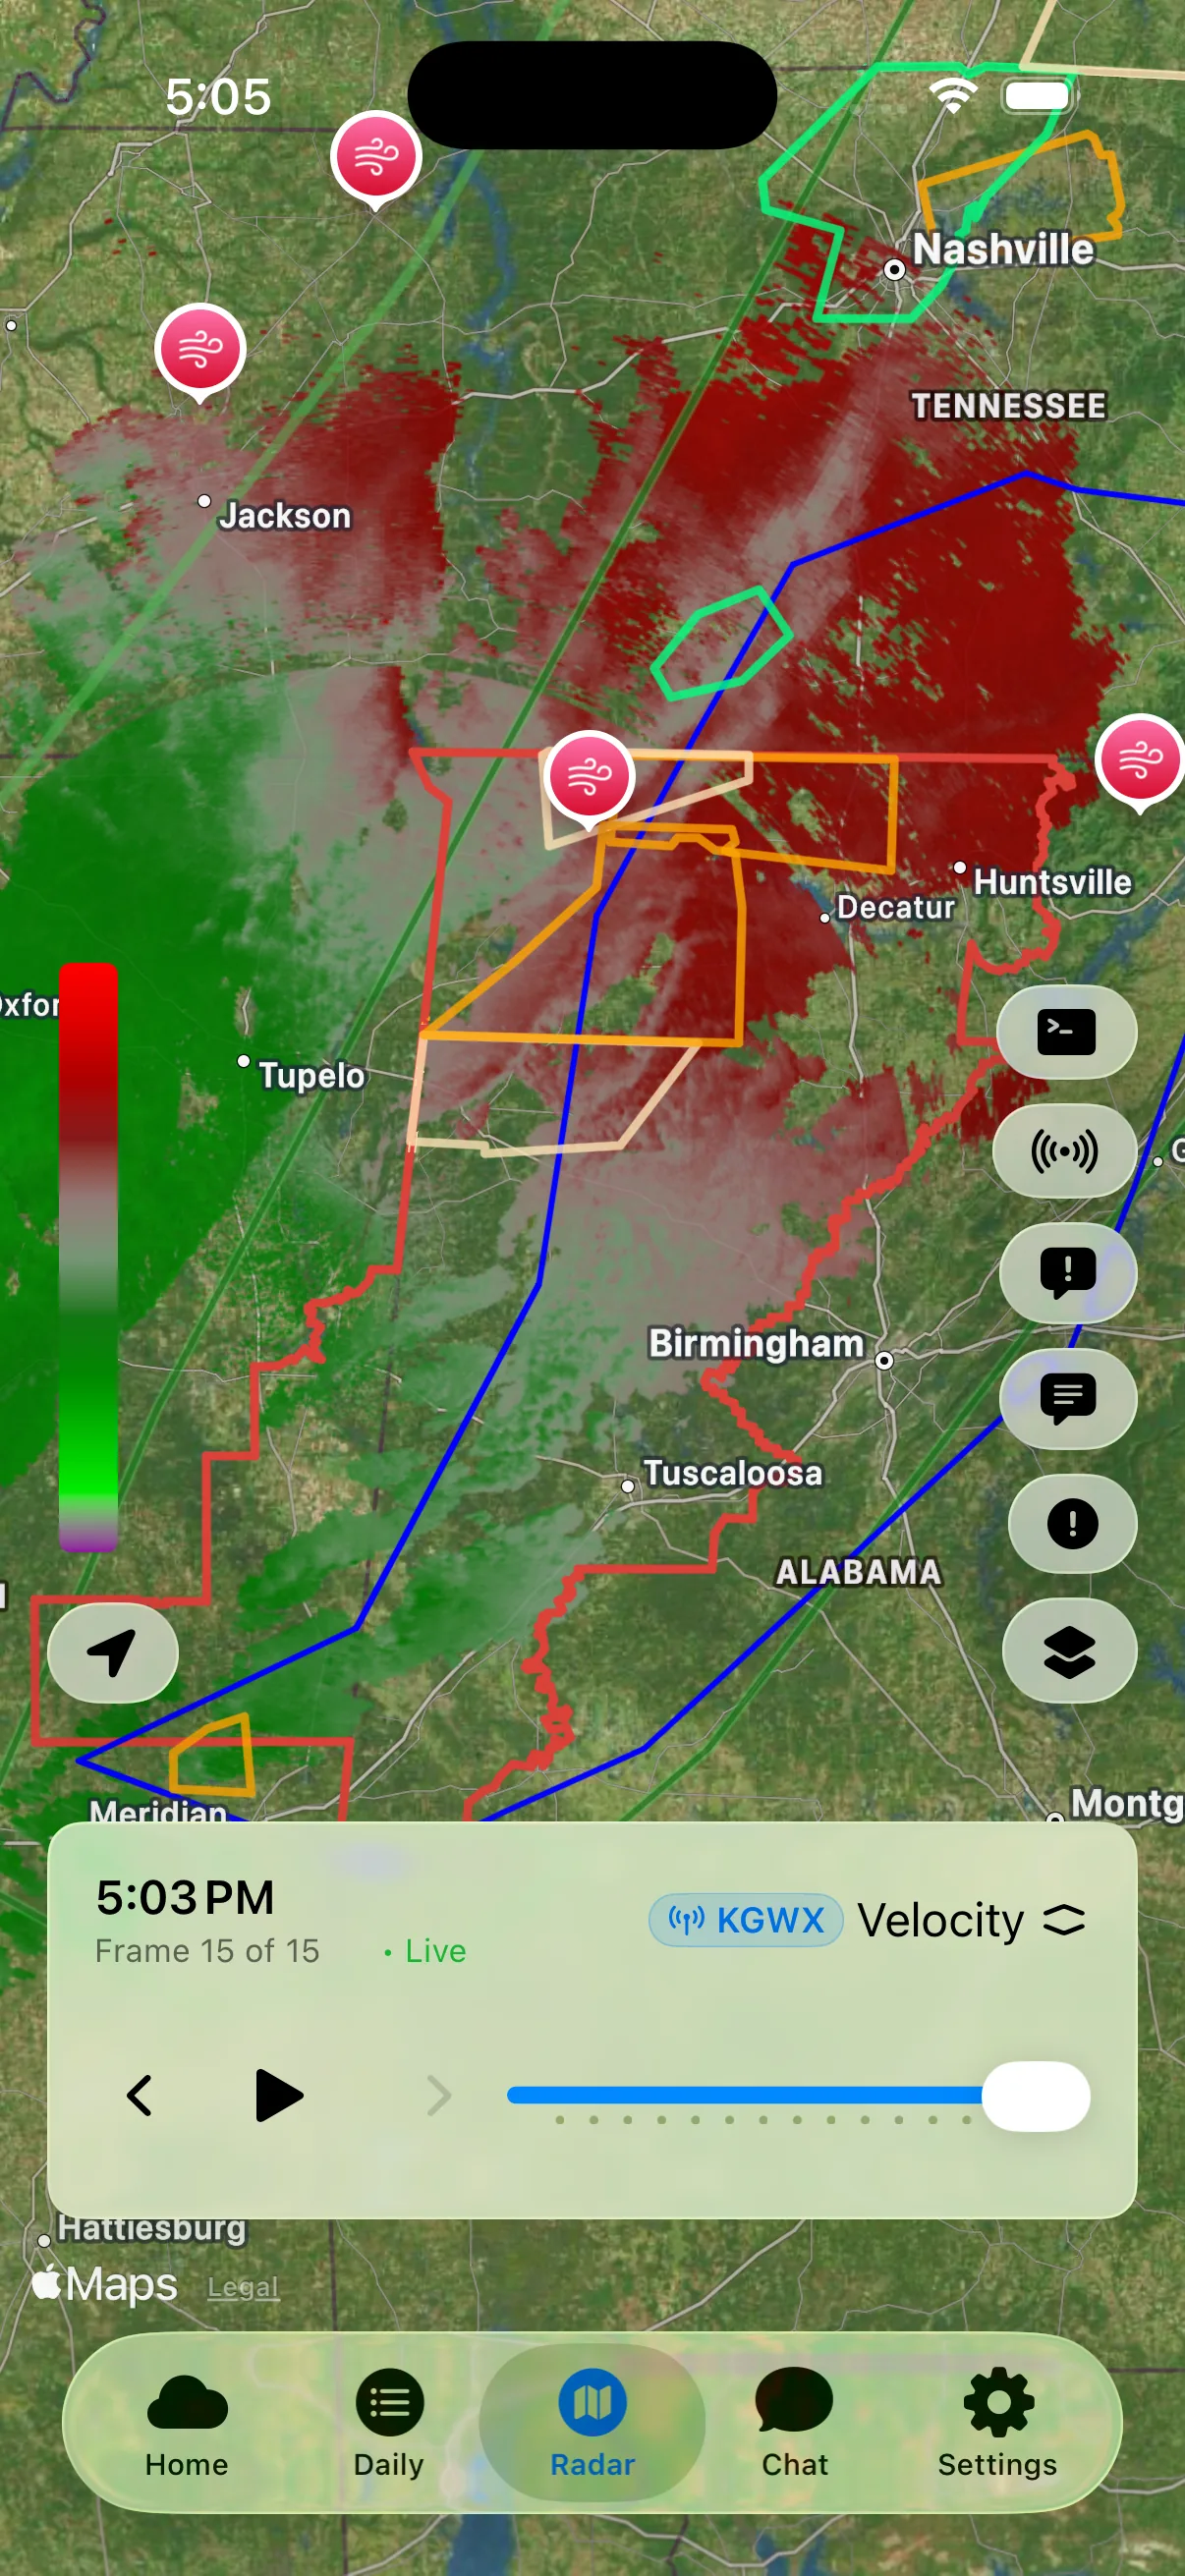
Doppler Velocity: Wind Detection
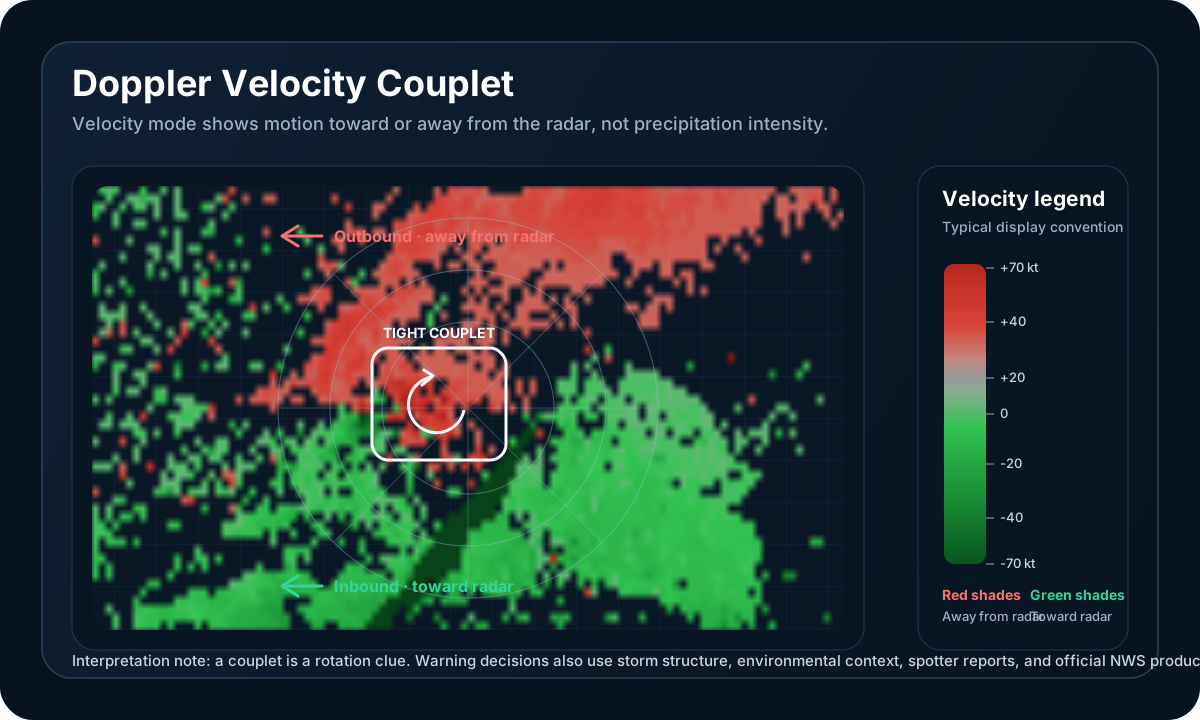
Doppler radar measures how fast precipitation is moving toward or away from the radar station. This reveals:
- Rotation (potential tornadoes)
- Wind shear (turbulence for aviation)
- Storm intensity
In WeatherAI, the AI automatically analyzes Doppler data and warns you about dangerous wind conditions.
Radar Layers You Should Know
Base Reflectivity
- Standard radar view showing precipitation
- Best for tracking rain and storm location
- What most people think of as "radar"
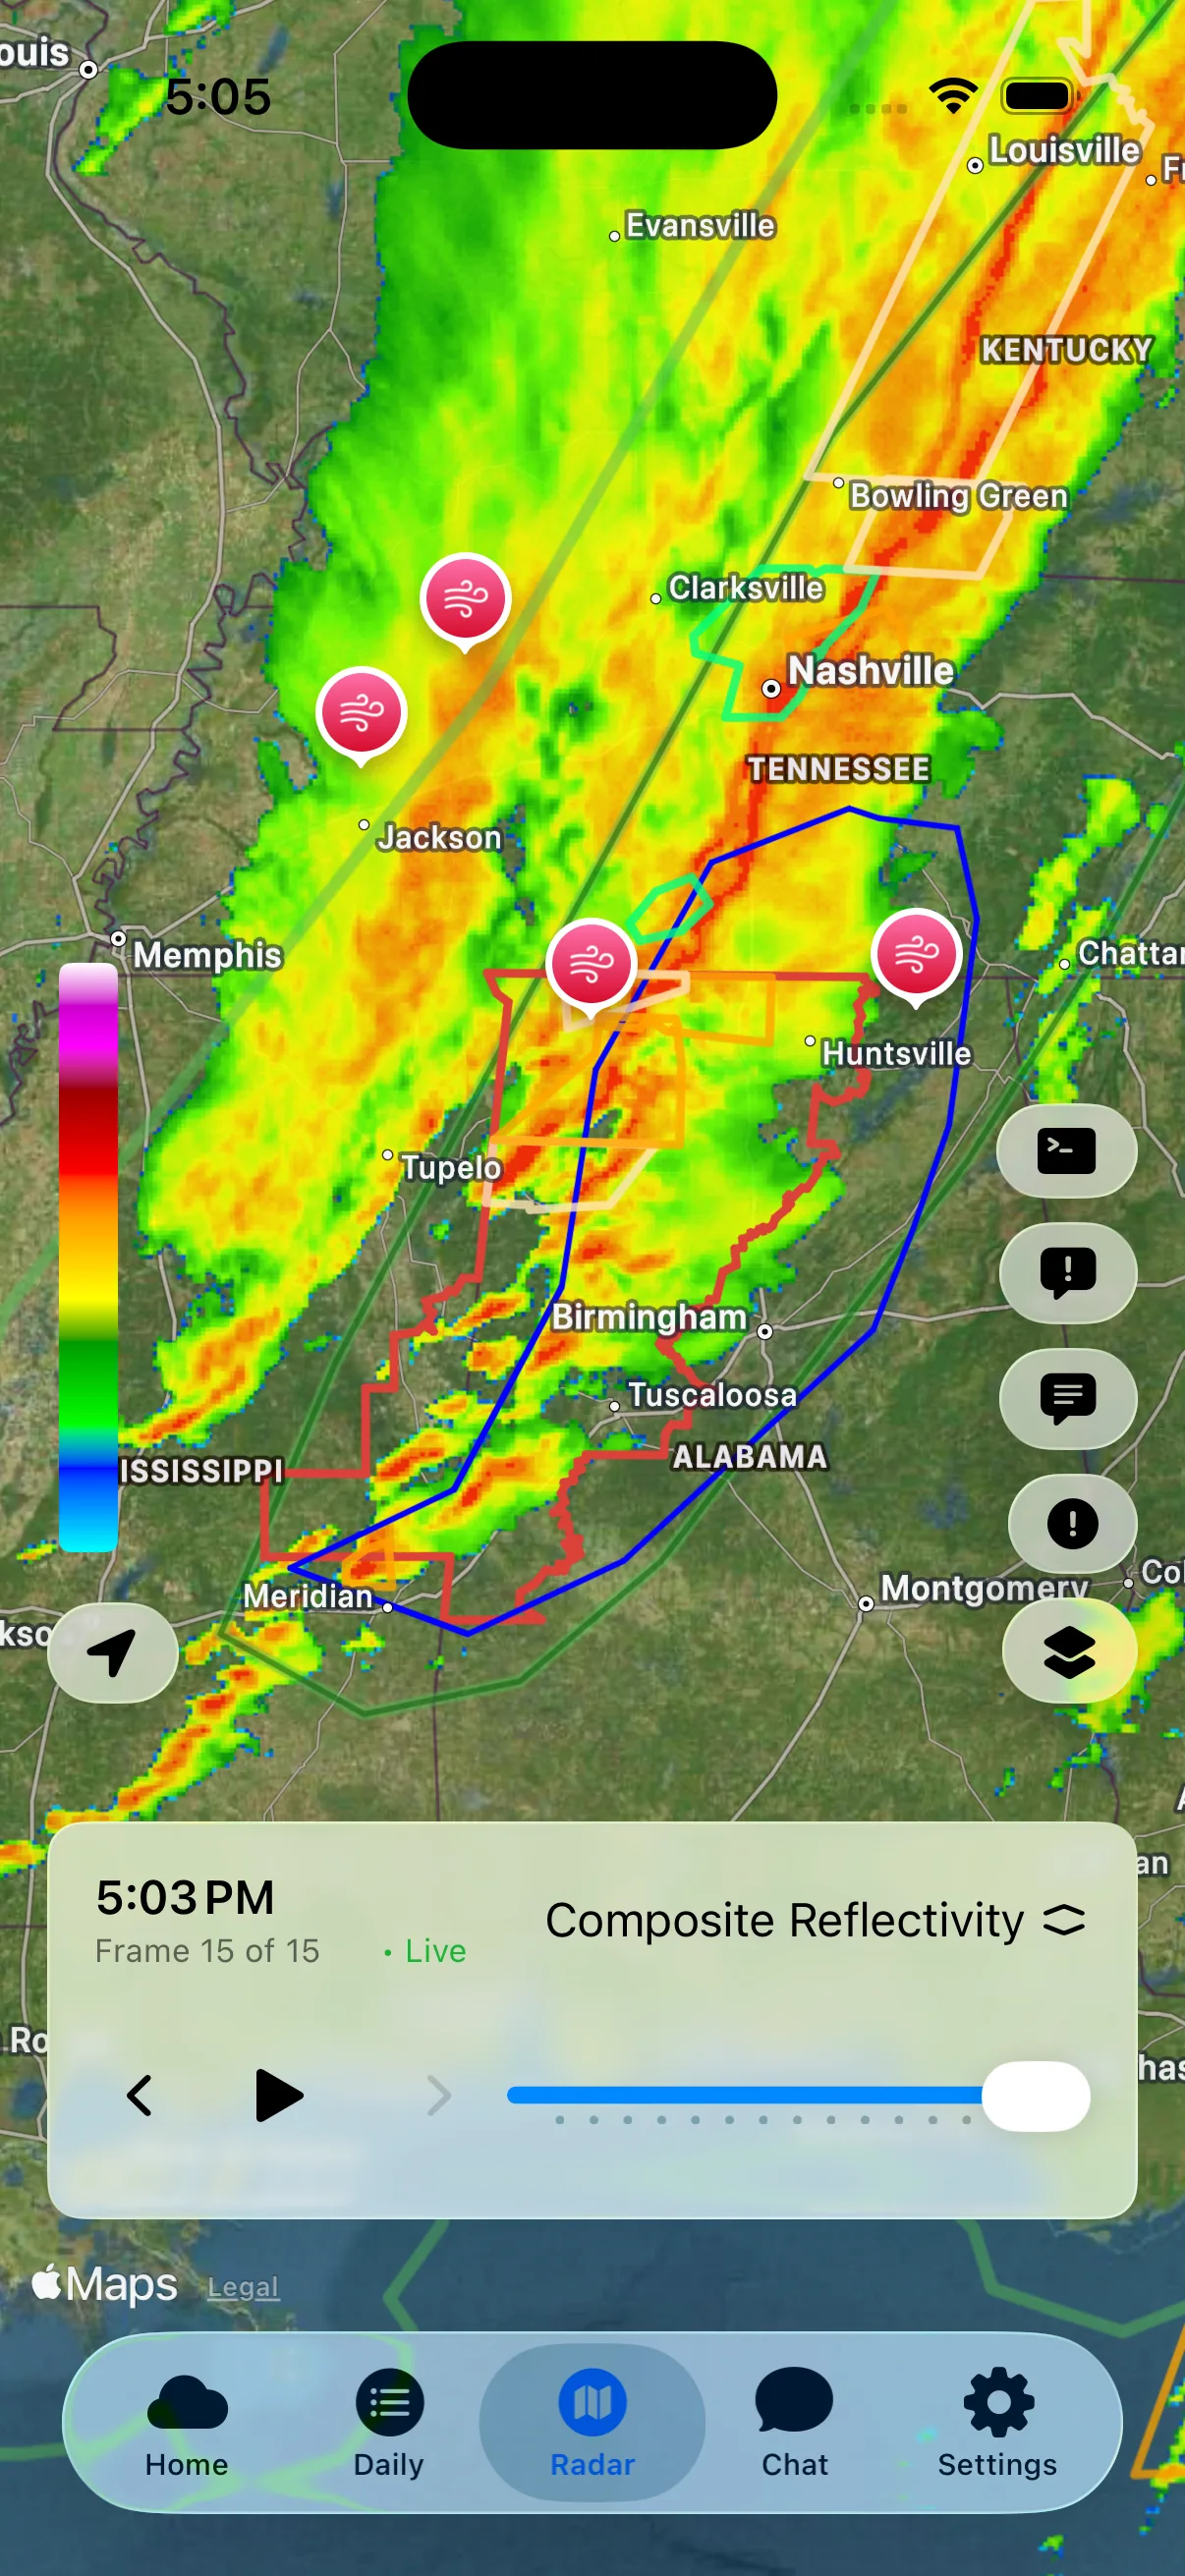
Composite Reflectivity
- Shows the strongest returns from all altitudes
- Reveals severe weather hidden in storms
- Better for detecting hail
Lightning Layer ⚡
- Lightning detection overlaid on radar, subject to network coverage and reporting latency
- Treat it as situational awareness, not an all-clear tool: lightning can strike well outside the area showing recent activity
- The reliable rule is still the simplest one: when thunder roars, go indoors, and stay there for 30 minutes after the last rumble
Velocity
- Shows wind movement within storms
- Used by professionals to spot rotation
- Helps identify tornadoes before they touch down
Precipitation Accumulation
Some radars estimate total rainfall over time. This helps identify:
- Flash flood risk
- Areas that received the most rain
- Whether drought conditions are improving
WeatherAI aggregates this data and answers questions like: "How much rain fell at my location today?"
Common Radar Misinterpretations
❌ Radar Shadows
What it looks like: Gaps or weak spots behind mountains or tall buildings What it really is: Blocked radar signals, not clear skies What to do: Check surrounding areas; rain might still be falling there
❌ Ground Clutter
What it looks like: Permanent green/yellow spots near the radar station What it really is: Buildings, trees, or terrain reflecting signals What to do: Ignore stationary returns that don't move with animations
❌ Beam Overshooting
What it looks like: Storms appear weaker than they are What it really is: Radar beam passes over low-level precipitation What to do: If storms are far from radar, expect heavier rain than shown
❌ Non-Precipitation Echoes
What it looks like: Strange patterns on radar What it really is: Birds migrating, insects, smoke, or chaff What to do: Check if the "precipitation" is moving with the wind
How to Use Radar for Planning
For Commuters
- Check radar 30 minutes before leaving
- Look for gaps in precipitation you can travel through
- Use WeatherAI's timeline to see if rain will pass before your commute
- Ask: "Will it rain during my drive home at 5pm?"
For Outdoor Events
- Monitor radar starting 6 hours before the event
- Look for squall lines or fast-moving storms that might disrupt plans
- Check lightning layers - if present, postpone outdoor activities
- Use the AI: "Is it safe to have a picnic at 2pm today?"
For Severe Weather
- Look for hook echoes and bow echoes on radar. Wall clouds are a visual feature spotters report from the ground, not something radar shows
- Enable WeatherAI's severe weather alerts for automatic warnings
- Watch velocity data for rotation (if available)
- Have a shelter plan if you see dangerous patterns
Pro Tips from Meteorologists
Loop the radar animation - Don't just look at a single frame; watch how storms evolve over 30-60 minutes
Check multiple radar sites - One radar might miss low-level storms; WeatherAI combines data from multiple sources
Cross-reference with satellite - Radar shows precipitation, satellite shows clouds; together they tell the full story
Trust the AI assistant - WeatherAI's conversational AI analyzes radar patterns faster than humans and explains what it sees in plain English
Update frequently - Radar refreshes every 5-10 minutes; severe weather can develop quickly
Know your radar's range - Most radars effectively cover 100-125 miles; beyond that, accuracy drops
Using WeatherAI's Radar Features
WeatherAI makes radar interpretation effortless:
Interactive Radar
- Pinch to zoom into your neighborhood
- Tap anywhere for detailed precipitation info
- Animate the last 2 hours to track storm movement
AI Radar Analysis
Just ask:
- "What's on the radar near me?"
- "Is that storm going to hit my location?"
- "How long until the rain passes?"
The AI analyzes the radar and gives you a human-readable answer in seconds.
Notifications
Nothing watches the radar on your behalf. What WeatherAI can notify you about is:
- Official severe weather alerts for your current and saved locations
- Custom rules you set yourself, each watching one data point against one threshold at a time of day you choose
Practice Makes Perfect
The best way to master radar interpretation is to check it regularly and compare what you see with actual weather conditions. Over time, you'll develop an intuitive sense for:
- How fast storms move in your area
- What "bad" radar signatures look like
- When to trust the forecast vs. the current radar
With WeatherAI's conversational AI, you can learn as you go: just ask questions about what you see on the radar.
Frequently Asked Questions
How can you tell rain from snow on weather radar?
Look at the color family and how the area is shaped, then confirm with the surface temperature. Rain usually shows as green, yellow and orange patches with fairly smooth edges, while snow tends to appear as light blue or pink shading spread across a large, uniform area, and sleet or freezing rain often renders pink or magenta in winter. Snow also returns a weaker signal than rain for the same precipitation rate, so a heavy snow band can look deceptively pale next to an ordinary summer shower.
The caveat is that precipitation type on a radar map is a derived product rather than a direct measurement, and palettes are not standardized between apps. The beam is sampling the atmosphere thousands of feet above you, so snow aloft can melt into rain on the way down, and rain can freeze the moment it touches a cold road. Check the temperature at ground level before you trust the color.
What does a hook echo mean on radar?
A hook echo is a hook or comma shaped curl of precipitation wrapping around the back edge of a supercell thunderstorm, and it means the storm may be rotating strongly enough to produce a tornado. The tornado, if one exists, usually forms near the tip of the hook. Meteorologists rarely act on the shape alone: they switch to the velocity product and look for a tight couplet of red and green sitting side by side, which shows air moving toward and away from the radar within the same small area.
If a hook echo is close to you, take shelter rather than waiting for confirmation, and check official warnings. Be aware that a hook can appear without a tornado ever forming, and tornadoes can occur with no textbook hook at all, which is common in fast moving line storms where the rotation is small and short lived.
How often does weather radar update?
Most radar imagery refreshes every 5 to 10 minutes. Radars scan faster when there is something to see: a National Weather Service NEXRAD site completes a full volume scan in roughly 4 to 6 minutes in precipitation mode, but takes up to about 10 minutes in clear air mode when there is little to detect. Apps and websites add a little processing and delivery latency on top of that, so the frame you are looking at is usually a few minutes old.
That cadence changes how you should read the picture. A storm moving 40 mph covers roughly 3 to 7 miles between frames, so the newest image is already slightly out of date when you open it. Assume the storm is a little further along than what you see, and lean on the animation and arrival estimates instead of a single still frame.
Why does radar show returns on a clear day?
Because radar detects anything that reflects its beam, not just precipitation. Birds, insects, smoke, dust and chaff all return energy, and so do buildings, trees and terrain near the radar site, which produce the permanent speckled patch known as ground clutter. Virga is another common one: rain really is falling aloft where the radar can see it, then evaporates before it reaches the ground.
The animation is the fastest test. Real precipitation drifts with the wind and changes shape from frame to frame, while ground clutter sits in exactly the same spot loop after loop. Biological returns tend to look like a shapeless bloom centered on the radar site that grows around dawn or on warm evenings and never organizes into anything storm shaped.
How do I tell which way a storm is moving and when it will reach me?
Loop the animation and extend the motion you can actually see, which is the only reliable method. Note where the cell sat over the last 30 to 60 minutes, measure how far it traveled against a landmark or the distance scale, and project that same track forward. For timing, divide the distance the cell covered by the time it took to get a rough speed, then divide the distance still between it and you by that speed: a storm that moved 20 miles in 30 minutes is running about 40 mph, so a cell 20 miles out is roughly half an hour away. Do not judge direction from a storm's shape, because elongation reflects wind shear and how the storm formed rather than where it is going, supercells often deviate to the right of the mean flow, and a line of storms can propagate in a direction quite different from the individual cells inside it.
Weather systems in North America generally move west to east, which is a useful sanity check but not a forecast. Expect your estimate to drift, since storms grow, collapse and re-form along their flanks, and a cell can appear to jump forward when new development fires ahead of the old core. Re-check every few frames rather than trusting one projection.
Conclusion
Understanding weather radar transforms you from a passive observer into an informed decision-maker. Whether you're:
- Commuting safely around storms
- Planning outdoor activities with confidence
- Protecting your family during severe weather
Radar literacy is a valuable life skill.
And with WeatherAI's combination of live radar + conversational AI, you get the best of both worlds: professional-grade data with instant, understandable explanations.
Ready to become a radar expert?
Download WeatherAI for iPhone →
Have questions about radar interpretation? Ask our AI directly in the app, or contact support.
Keep Reading
These articles cover adjacent weather questions, practical explainers, and planning workflows related to this topic.
Weather Education
Understanding Flash Floods: Causes, Warnings, and Safety
Learn what causes flash floods, how to spot the risk on radar, the difference between watches, warnings, and emergencies, and critical safety steps that save lives.
Weather Education
What Causes Thunder and Lightning? The Science Behind Thunderstorms
Learn how lightning forms through charge separation in thunderstorm clouds, the different types of lightning, what causes thunder, and how to stay safe during electrical storms.
Weather Education
Typhoon vs Hurricane vs Cyclone: Same Storm, Three Names
A typhoon and a hurricane are the same kind of storm with the same 74 mph threshold. What changes is the ocean basin, the agency, and how the wind is measured. Here is the full naming map.
Useful Next Stops
Jump from the explainer into tools, feature pages, and seasonal hubs that deepen the topic.
Feature
Professional Radar
Explore high-resolution radar, premium lightning, and satellite layers built for serious weather tracking.
Feature
Custom Alerts
Set weather notifications that match the places and conditions you actually care about.
Guide
Lightning Safety Guide
Know when lightning becomes dangerous, how far away it can strike, and when to move indoors.
Glossary
Drizzle
Very light precipitation consisting of tiny water droplets less than 0.5mm in diameter that appear to float in the air.