What an El Niño Winter Usually Brings, Region by Region
Seventy-five years of NOAA records show what strong El Niño winters actually did across the U.S.: a mild northern tier, a wet southern one, and why weak events barely shift the odds.
Quick Answer: What Past El Niño Winters Actually Did
The textbook El Niño winter is a mild northern U.S. and a wet southern one. We checked that against NOAA's own records for every winter since 1950, and the short version is this: the textbook holds up well in strong El Niño winters, and barely at all in weak ones.
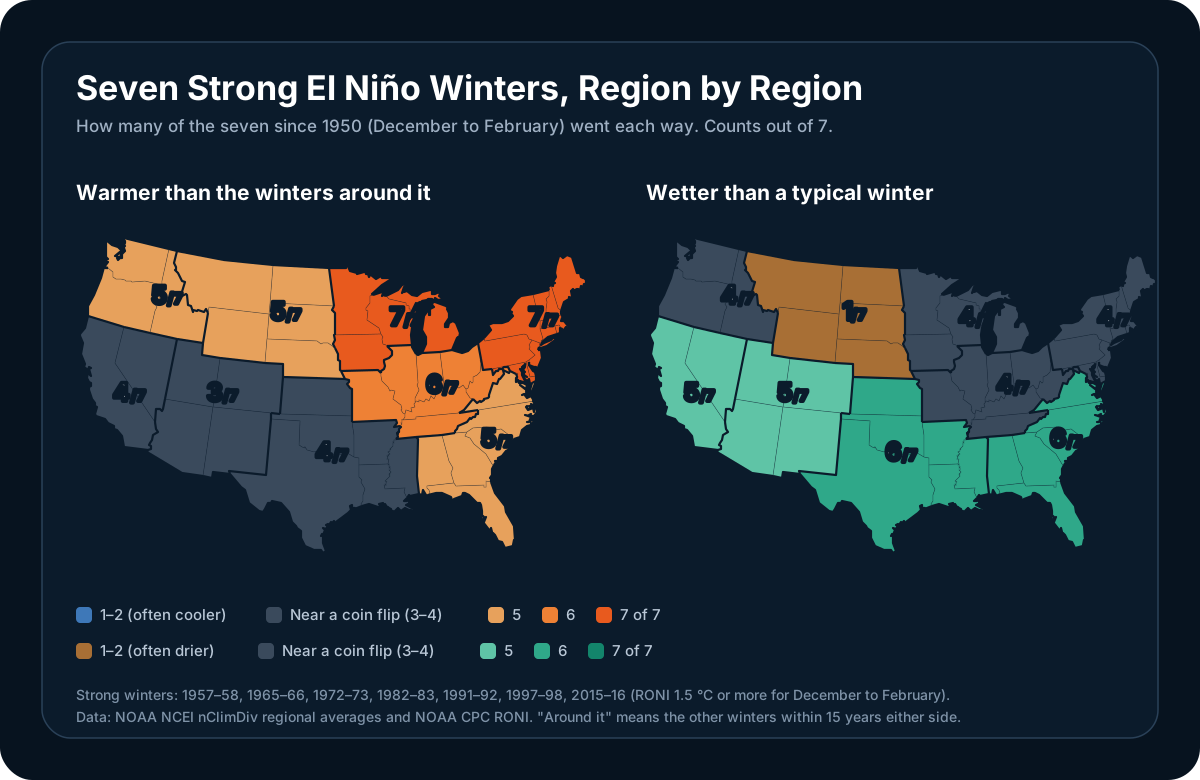
There have been seven strong El Niño winters since 1950: 1957–58, 1965–66, 1972–73, 1982–83, 1991–92, 1997–98 and 2015–16. Here is how many of those seven went each way in each of NOAA's nine U.S. climate regions:
| Region | States | Ran warmer | Ran wetter |
|---|---|---|---|
| Upper Midwest | MN, WI, MI, IA | 7 of 7 | 4 of 7 |
| Northeast | New England, NY, PA, NJ, MD, DE | 7 of 7 | 4 of 7 |
| Ohio Valley | OH, IN, IL, KY, TN, MO, WV | 6 of 7 | 4 of 7 |
| Northern Rockies and Plains | MT, WY, ND, SD, NE | 5 of 7 | 1 of 7 |
| Northwest | WA, OR, ID | 5 of 7 | 4 of 7 |
| Southeast | FL, GA, AL, SC, NC, VA | 5 of 7 | 6 of 7 |
| South | TX, OK, KS, AR, LA, MS | 4 of 7 | 6 of 7 |
| West | CA, NV | 4 of 7 | 5 of 7 |
| Southwest | AZ, NM, UT, CO | 3 of 7 | 5 of 7 |
| Contiguous U.S. | 5 of 7 | 7 of 7 |
"Warmer" means warmer than the other winters within 15 years either side, so the long-term warming trend doesn't make every recent winter look warm. "Wetter" means more precipitation than the median winter since 1950. A region that just flipped a coin each winter would land near 3 or 4 of 7.
If you remember three things:
- Strength matters more than anything else. The seven strong winters line up with the textbook. The thirteen weak ones mostly don't.
- The northern warmth is the most reliable signal. The Upper Midwest and Northeast ran warm in every strong El Niño winter on record.
- The southern rain is reliable, but California is the exception that gets the headlines. The South and Southeast were wetter in 6 of 7. California was wetter in 5 of 7, and even one of those five, 2015–16, left Southern California dry.
For where this winter's El Niño stands right now, see our live El Niño 2026 explainer. This post is about what history says to expect.
Why El Niño Reaches Your Winter at All
El Niño is a warming of the tropical Pacific, thousands of miles from most of the United States. It reaches North America through the jet stream.
When the central and eastern Pacific run warm, the thunderstorms that normally sit over Indonesia shift east toward the middle of the ocean. That shifts where the atmosphere releases heat, which strengthens the Pacific jet stream and stretches it east across the southern United States. Storms follow the jet, so the southern tier gets more of them. Meanwhile the polar jet, the one that delivers Arctic air, tends to stay farther north in Canada, so the northern tier sees fewer deep cold outbreaks.
NOAA's own summary is careful about how firm this is: the pattern is "a matter of probability, not certainty," and not every impact shows up in every event. The rest of this post is what that probability looks like when you count.
Strength Changes Everything
The single biggest finding in the data is how little a weak El Niño does.
| 7 strong winters | 13 weak winters | |
|---|---|---|
| Upper Midwest ran warmer | 7 of 7, average +4.2 °F (+2.3 °C) | 5 of 13, average −0.9 °F (−0.5 °C) |
| Northeast ran warmer | 7 of 7, average +2.7 °F (+1.5 °C) | 5 of 13, average −1.1 °F (−0.6 °C) |
| South ran wetter | 6 of 7, average 130% of normal | 6 of 13, average 101% |
| Southeast ran wetter | 6 of 7, average 124% of normal | 7 of 13, average 100% |
| Contiguous U.S. ran wetter | 7 of 7, average 114% of normal | 6 of 13, average 100% |
In weak El Niño winters, every one of those signals is indistinguishable from chance. The northern tier actually averaged slightly cooler than its era. That's why "El Niño is coming" on its own tells you very little about your winter, while "a strong El Niño is coming" tells you quite a lot.
Moderate events (six winters, including 2009–10 and 2023–24) sit in between and are the least predictable group of all. They produced both the warmest winter on record for the contiguous U.S. (2023–24) and a cold winter across the South that gave Florida its 10th-coldest on record (2009–10).
A note on how events are sorted: we used NOAA's Relative Oceanic Niño Index (RONI) for December to February, the index NOAA has classified El Niño on since February 2026. A strong event is RONI +1.5 °C or more. On the older ONI index a few events change category, most notably 2023–24, which was strong on ONI and is moderate on RONI. Our El Niño 2026 explainer covers why the two indices differ.
The Northern Tier: The Most Reliable Signal
Upper Midwest and Northeast: warm in every strong event. Seven out of seven, with the Upper Midwest averaging 4.2 °F above the winters around it. The biggest years were enormous. 1997–98 was Minnesota's second-warmest winter since records began in 1895–96, and 2023–24, a moderate event, took first place for Minnesota, Wisconsin and the Upper Midwest region as a whole.
Ohio Valley: warm in 6 of 7, averaging 2.6 °F above its era. Precipitation is a toss-up: the region averaged exactly 100% of normal across the strong winters.
Northern Rockies and Plains: warm and dry. Five of seven ran warm, and only 1 of 7 was wetter than a typical winter. None of the seven landed in the wettest third of the record. 1991–92 was Montana's sixth-driest winter on record, and 1986–87, a moderate event, its second-driest.
What this doesn't tell you is how much snow you'll get. Snow depends on individual storm tracks and on temperatures right at the freezing line, and a mild season can still produce a big storm. NOAA doesn't issue seasonal snowfall forecasts at all, which is worth remembering when someone gives you a winter snow total for your city. We cover why even three-day snow forecasts vary so much in a separate guide.
The South and Southeast: Reliably Wet, Not Reliably Cool
South: wetter in 6 of 7, averaging 130% of normal precipitation. Texas had its wettest winter on record in 1991–92, and 1982–83 and 1997–98 were the region's third- and fourth-wettest.
Southeast: wetter in 6 of 7, averaging 124% of normal, and none of the seven strong winters finished in the driest third of the record. 1997–98 was the wettest winter on record for both Florida and the Southeast region as a whole. In 2015–16, the Lower East Coast of Florida, the Miami area, had its wettest winter since records began.
The textbook also says the southern tier runs cool. The data says that's the weakest part of the picture. The Southeast ran warmer than its era in 5 of 7 strong winters, and the South in 4 of 7. The extra clouds and rain do hold daytime temperatures down, but over a whole season the cooling signal is small and has been getting smaller as winters warm overall.
There's one big exception, and it's a memorable one. 1957–58, a strong El Niño, is still Florida's coldest winter on record. El Niño shifts the odds. It doesn't overrule a cold outbreak once one gets going.
California and the Southwest: Big Upside, Real Misses
West (California and Nevada): wetter in 5 of 7, averaging 123% of normal. Southwest: wetter in 5 of 7, averaging 117%.
The averages hide how lopsided California's results are. When a strong El Niño delivers, it delivers hugely:
- 1997–98 was California's third-wettest winter on record, and its South Coast (Los Angeles to San Diego) recorded about 2.5 times its average winter precipitation.
- 1982–83 brought 150% of normal to the South Coast and 153% to the North Coast.
- 1957–58 was the North Coast's third-wettest winter on record.
But two of the seven strong winters came in drier than a typical winter, both for California as a whole and for the West region:
- 1965–66 left California at 78% of normal.
- 1991–92 left California at 90%, with the state split in two: the North Coast got only 65% of normal while the South Coast got 150%.
The most famous disappointment isn't one of those two. 2015–16, one of the strongest El Niños on record, ended slightly wet for California as a whole, at 106% of normal, but the extra rain went north. California's North Coast got 132% of normal, while Southern California got only about two-thirds. It's the reason "El Niño means a wet California" became a much more cautious statement afterward.
And the wettest California winter on record, 1968–69, came from a moderate El Niño.
Most of California's winter rain arrives in a handful of big storms, so a few atmospheric rivers more or less can swing the whole season. That's also why research now points to atmospheric rivers as the reason some El Niño winters break from the composite. Our guide to atmospheric rivers and what El Niño does to them goes into that.
The Pacific Northwest: Milder, Not Reliably Drier
El Niño's reputation in the Northwest is a mild, dry winter. The record backs up the mild part: the region ran warmer than its era in 5 of 7 strong winters, averaging 1.7 °F above.
The dry part is weaker than its reputation. Measured over December to February, the Northwest was wetter than a typical winter in 4 of 7 strong events and averaged 103% of normal. Strong El Niños have produced both wet winters there (1957–58, 1982–83 and 2015–16 all came in above 125% of normal) and dry ones (1991–92, at 70%). Warmer winters do tend to mean more of that precipitation falls as rain rather than snow at lower elevations.
Alaska, Hawaii and Canada
Alaska: dry, but not reliably warm statewide. Six of the seven strong El Niño winters finished in Alaska's driest third. Temperature is a split, warm in 3 of 7 statewide.
Hawaii: the most consistent dry signal of anywhere. NOAA's Hawaii record starts in 1991–92, and every moderate and strong El Niño winter since then, six in all, finished in the driest third. The three strong ones averaged about half of normal winter rainfall. In Hawaii, El Niño winters are drought winters.
Canada: warm, especially in the west and center. Environment and Climate Change Canada's national records go back to 1948, and its two warmest winters are both El Niño winters. 2023–24 set the record at 5.2 °C above the 1961–1990 average, breaking the previous record by 1.1 °C. The previous record holder was 2009–10, another El Niño winter.
The Winters That Broke the Pattern
Every one of these happened during a moderate or strong El Niño:
| Winter | What happened |
|---|---|
| 1957–58 (strong) | Florida's coldest winter on record |
| 1965–66 (strong) | California and Nevada ended up dry, at 77% of normal |
| 1968–69 (moderate) | California's wettest winter on record |
| 1991–92 (very strong) | Pacific Northwest dry at 70% of normal, while Texas had its wettest winter on record |
| 2009–10 (moderate) | A cold winter across the South, and Florida's 10th-coldest on record |
| 2015–16 (very strong) | Southern California got about two-thirds of normal while the North Coast got 132% |
None of these mean the pattern is wrong. They mean seven events is a small sample, and every El Niño arrives alongside other things happening in the atmosphere, from the state of the North Pacific to polar vortex disruptions that can swamp the seasonal signal for weeks.
What This Means for Winter 2026–27
This winter's El Niño is on track to be strong or stronger, which puts it in the group where the historical pattern has held up best. Going by the record, the safest calls are a mild winter across the northern tier from the Rockies to New England, and a wet one along the Gulf Coast and in Florida. California's odds of a wet winter are good but not certain: two of the seven strong winters came in dry statewide, and 2015–16 left Southern California dry even though the state as a whole ended slightly wet.
There is one important caveat: an event that ends up stronger than anything since 1950 would be outside the range of these seven winters. For the current strength numbers, NOAA's probabilities and its official winter outlook, see our live El Niño 2026 explainer, which we update as NOAA releases new data.
How We Counted
- Data: NOAA NCEI's nClimDiv dataset, which averages station observations across each state and NOAA's nine U.S. climate regions. We used December, January and February for every winter from 1950–51 through 2025–26.
- Event strength: NOAA CPC's RONI value for December to February. Weak is +0.5 °C up to +1.0 °C, moderate +1.0 °C up to +1.5 °C, and strong +1.5 °C or more. That gives 7 strong, 6 moderate and 13 weak El Niño winters.
- Temperature: each winter compared with the average of the other winters within 15 years either side of it. Comparing against a fixed average would make every recent winter look warm because of long-term warming.
- Precipitation: each winter's total compared with the median winter in the 1950–51 to 2025–26 record. Percentages are relative to the average over the same period.
- Records: "on record" means the full nClimDiv history back to winter 1895–96, except Alaska (from 1925) and Hawaii (from 1991–92).
Frequently Asked Questions
Does El Niño mean a warm winter?
In the northern United States, a strong El Niño usually does. The Upper Midwest and Northeast ran warmer than the surrounding winters in all seven strong El Niño winters since 1950, and the Ohio Valley in six of seven. A weak El Niño makes almost no difference: the same regions ran warm in only 5 of 13 weak El Niño winters.
Does El Niño mean a wet winter in California?
It raises the odds, and when it delivers it can deliver a lot: 1997–98 was California's third-wettest winter on record. But it's not guaranteed. California and Nevada were wetter than typical in 5 of the 7 strong El Niño winters since 1950. The two statewide misses were 1965–66 and 1991–92. The best-known disappointment, 2015–16, ended slightly wet statewide but gave Southern California only about two-thirds of its normal winter precipitation.
Does El Niño mean less snow?
Not in a way anyone can forecast for a specific place. Strong El Niño winters run milder across the northern tier, which can mean more rain and less snow at marginal temperatures, but a mild season can still produce major snowstorms. NOAA does not issue seasonal snowfall forecasts.
How strong does an El Niño need to be to affect my winter?
Strong, based on the record. In the seven strong winters since 1950 (RONI +1.5 °C or more for December to February), the classic pattern showed up consistently. In the thirteen weak winters it was indistinguishable from chance. Moderate events fall in between and have produced both very warm and very cold winters.
Which El Niño winters were the strongest?
On NOAA's RONI index for December to February, the four very strong El Niño winters since 1950 were 1982–83 (+2.40 °C), 2015–16 (+2.14 °C), 1997–98 (+2.13 °C) and 1991–92 (+2.12 °C). The other three strong winters were 1957–58, 1972–73 and 1965–66.
Get Ready for Winter With WeatherAI
A seasonal pattern tells you what kind of winter to expect. WeatherAI tells you what's coming this week, on your iPhone:
- Official winter alerts from the National Weather Service and Environment Canada, for where you are and up to 10 saved places, free
- Your own snow threshold. Set a custom rule on forecast snowfall and get a notification at the time you choose when it's over your line (Standard and Pro)
- Your local forecaster's reasoning. Get notified when your National Weather Service office issues a new Area Forecast Discussion, the write-up where forecasters explain what they expect and how confident they are
- Professional-grade radar for when the storm is actually on its way
- Ask in plain English: "How much rain or snow is this weekend's storm bringing here?" gets an answer for your location
Download WeatherAI for iPhone →
Sources.
- NOAA NCEI nClimDiv statewide and regional monthly temperature and precipitation, file version dated 6 October 2026, read 19 October 2026: every regional count, average, percentage and record ranking above. Region definitions follow NCEI's U.S. climate regions
- NOAA CPC RONI series, read 19 October 2026: the December to February value used to sort each winter by strength
- NWS Public Information Statement 26-05, 13 January 2026: NOAA's switch from ONI to RONI
- NOAA Climate.gov, How El Niño and La Niña affect the winter jet stream and U.S. climate: the jet stream mechanism and the "probability, not certainty" caveat
- NOAA Climate.gov, U.S. climate winter recap and summary, February 2024: winter 2023–24 as the contiguous U.S.'s warmest on record
- Environment and Climate Change Canada, Climate Trends and Variations Bulletin, Winter 2023/2024: Canada's warmest winter since 1948 and the previous 2009–10 record
Following this winter's El Niño as it happens? Our El Niño 2026 explainer tracks NOAA's latest numbers, and our guides to atmospheric rivers and the polar vortex cover the two things most likely to make this winter break from the pattern.
Keep Reading
These articles cover adjacent weather questions, practical explainers, and planning workflows related to this topic.
Weather Education
El Niño 2026: How Strong It Is, and What It Actually Means
El Niño is strengthening in 2026, with NOAA calling a strong-to-very-strong event likely through winter and 83% odds of a historic peak that exceeds every event since 1950. What that means for hurricane season and winter.
Weather Education
What Is the Polar Vortex? Understanding Extreme Winter Cold
Learn what the polar vortex is, how it affects winter weather across North America, why it sometimes 'breaks down' to deliver extreme cold, and what to expect during polar vortex events.
Weather Education
What Is an Atmospheric River? The AR Scale, the Pineapple Express, and El Niño
Learn what an atmospheric river is, how the AR 1 to 5 scale works, what a Pineapple Express is, and whether a very strong El Niño means more of them for the West Coast this winter.
Useful Next Stops
Jump from the explainer into tools, feature pages, and seasonal hubs that deepen the topic.
Guide
El Niño 2026 Explained
Where the current El Niño stands and what a strong event means for hurricane season and the winter ahead.
Seasonal Hub
Winter Weather Guide
Find practical explainers on snow, freezing rain, wind chill, and winter travel risk.
Guide
Understanding Snow Totals
Why snow forecasts give ranges instead of exact numbers: snow ratios, banding, and elevation effects.
Glossary
Atmospheric River
An atmospheric river is a long, narrow corridor of concentrated water vapor moving through the lower atmosphere, typically 250 to 375 miles wide and often more than 1,000 miles long.