El Niño 2026: How Strong It Is, and What It Actually Means
El Niño is strengthening in 2026, with a greater than 90% chance of becoming very strong and 75% odds of exceeding every event since 1950. What that means for hurricane season and winter.
Quick Answer: What's Happening Right Now
The tropical Pacific is running a strengthening El Niño, and on 10 September 2026 NOAA nudged both of its headline calls higher again: a greater than 90% chance of a very strong event through autumn and winter, and a 75% chance it ends up stronger than any El Niño since records began in 1950.
| Measure | Where it stands |
|---|---|
| Official status | El Niño Advisory (in effect since 11 June 2026) |
| Latest official index | RONI +1.4 °C for June–July–August 2026 |
| Chance it's "very strong" in Oct–Dec | 98% |
| Chance it exceeds every event since 1950 | 75% (Oct–Dec, RONI +2.5 °C or more) |
| Chance El Niño conditions last into Feb–Apr 2027 | 97% |
| Expected peak | Late autumn to early winter 2026 |
NOAA's Climate Prediction Center put it in one sentence on 10 September 2026:
"El Niño is strengthening, with a greater than 90% chance of a very strong event during the Northern Hemisphere fall and winter 2026-27."
That is word for word the synopsis CPC published on 13 August. The sentence held still; the numbers under it did not. October–December went from a 95% chance of a very strong event to 98%, and the chance of a record from 69% to 75%. Two months earlier the synopsis had read "El Niño continues and will strengthen through the end of the year, with a 97% chance it will persist through early spring 2027," which is a forecast about duration rather than size. The emphasis moved to size in August and has stayed there.
A note on freshness: CPC re-issues its ENSO discussion on the second Thursday of each month. The most recent landed on 10 September 2026, and the next is due 8 October 2026. Every number in this post is stamped with the date it came from. If you're reading this well after publication, check the current discussion before quoting anything.
The Number You've Seen Is Probably One of Five
Here's the thing almost every article about this event gets wrong, and it's worth getting right before anything else.
If you've seen a number attached to this El Niño, it was probably +3.0, +2.1, +1.8 or +1.4. All of them are correct, and all of them describe the same patch of ocean, the Niño 3.4 box. There are five values in circulation and they collapse onto just those four figures, which is most of why coverage of this event garbles them. They differ on two axes: what window of time they average over, and whether background tropical warming has been removed.

Forecasters watch four boxes strung along the equator. Niño 3.4 (the middle one, straddling the Date Line side of the basin) is the one that defines the event, because that's where the ocean most reliably talks back to the atmosphere.
First axis: the time window. Two are a weekly snapshot, one is a single calendar month, and two are three-month averages.
| Reading | What it is | Period |
|---|---|---|
| +3.0 | Weekly, absolute | week of 16 Sep 2026 |
| +2.1 | Weekly, relative | week of 16 Sep 2026 |
| +1.8 | ONI (legacy) | June–August 2026 |
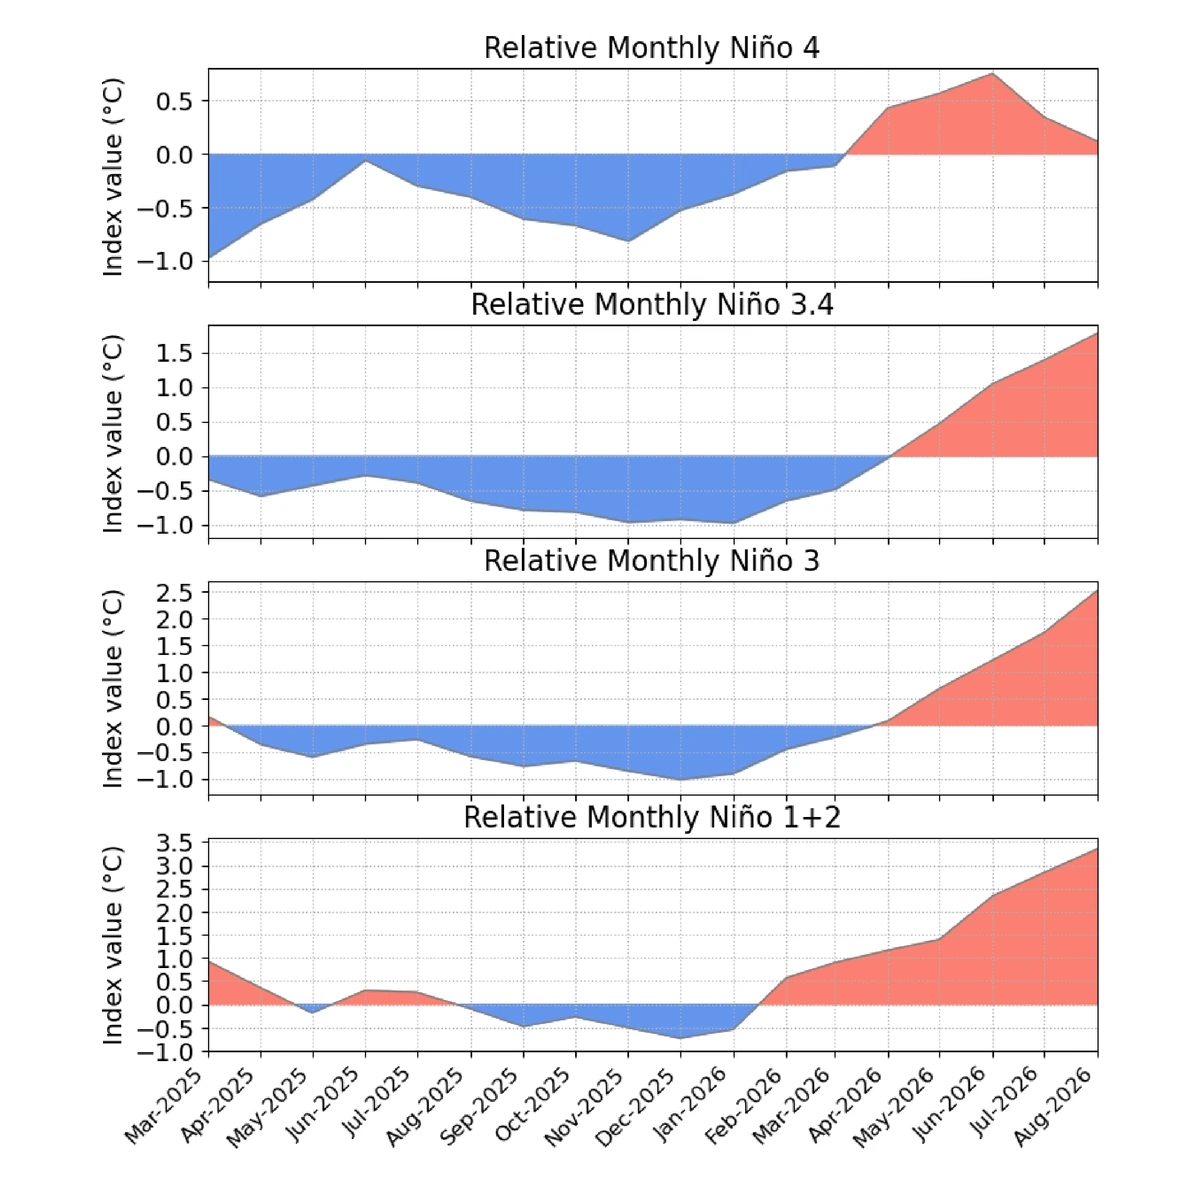
| +1.8 | Monthly, relative | August 2026 |
| +1.4 | RONI (official) | June–August 2026 |
Weekly values are noisy and jump around; the three-month averages are what actually classify an event. So the weekly +2.1 is not NOAA's classification number even though it's also "relative." RONI is, and it currently reads +1.4.
This month the table collides just once. +1.8 is the legacy ONI for June–August, and the single-month August value on the relative index that CPC quoted in its 10 September discussion. Two different averaging windows, one printed figure. That pile-up is an accident of where the numbers happen to sit this month, but while it lasts it is part of why so much coverage of this event garbles them. The weekly absolute, the weekly relative and RONI each stand alone this week, at +3.0, +2.1 and +1.4, and RONI is the one that classifies the event.
Second axis: absolute vs relative.
- Absolute anomaly: how far above the 1991–2020 average the water is.
- Relative anomaly: the same thing, minus the average warming across the whole tropics.
That second one matters more than it sounds. The entire tropical ocean has warmed. If you only measure a departure from a fixed average, every recent El Niño looks bigger than the one before it, partly for reasons that have nothing to do with El Niño. Subtracting the tropics-wide background strips that out and leaves the part that's actually the Pacific see-saw.
RONI does one more thing after that subtraction: it rescales the result so its variance matches the traditional index. Without that step the numbers would all shrink and the familiar weak/moderate/strong thresholds would stop meaning anything. It's the reason RONI values are still comparable to the ONI scale you may remember.
NOAA made the switch official on 1 February 2026. RONI is now the index NOAA classifies El Niño and La Niña on, replacing the traditional ONI. The legacy files keep publishing for continuity, which is exactly why several numbers are floating around at once.
The 2023–24 event shows why the change was made. On the old index it peaked at +1.99 °C in November–January, a hair from the "very strong" cutoff. On RONI it peaked at +1.42 °C in October–December, which lands in the moderate category. Same event, two indices, and a two-category difference in how it gets filed.
(Those two peaks fall in different three-month seasons, so the gap between them isn't a single clean quantity you can subtract and label. The point is the classification, not the arithmetic.)
So when you see a headline number, the useful question is which index. For this post: RONI is +1.4 °C for June–August 2026, and that's the number NOAA's official probabilities are built on.
What El Niño Actually Is
Strip away the jargon and El Niño is a story about wind, and what happens when the wind gives up.
Normally, trade winds blow steadily east to west along the equator, dragging surface water toward Indonesia. Warm water piles up in the west, enough that sea level there sits roughly a foot and a half higher than off South America. With the warm surface layer hauled westward, cold water wells up along the South American coast to replace it.
That warm western pool is where the thunderstorms live. Warm water evaporates, air rises, rain falls, and the rising air flows back east high above before sinking over the cold eastern Pacific. That loop is the Walker circulation.

Now weaken those trade winds. The piled-up warm water sloshes back east. The boundary between warm surface water and cold deep water, the thermocline, flattens out. Upwelling off South America is suppressed. It doesn't stop so much as stop mattering, because with the thermocline pushed deeper it draws up warm water instead of cold. The eastern Pacific warms.
And here's the part that makes El Niño self-sustaining: warmer water in the east means a smaller temperature contrast across the basin, and it's that contrast that drives the trade winds in the first place. Weaker contrast, weaker winds. Weaker winds, warmer east. The ocean and atmosphere egg each other on, a loop meteorologists call the Bjerknes feedback.
The consequence that reaches you has nothing to do with water temperature directly. It's that the planet's largest concentration of thunderstorms picks up and moves several thousand miles east. That relocated heat engine punches into the upper atmosphere, bends the jet streams, and rearranges weather patterns continents away.
How This One Spun Up in Four Months
What makes the 2026 event worth writing about isn't just its size. It's how fast it assembled. CPC's own month-by-month verdict tells the story better than any paraphrase:
| Discussion | CPC's read on the coupled ocean–atmosphere system |
|---|---|
| 12 March 2026 | "remained consistent with La Niña" |
| 9 April 2026 | "reflected ENSO-neutral conditions" |
| 14 May 2026 | "reflected ENSO-neutral conditions" |
| 11 June 2026 | "reflected the onset of El Niño conditions" |
| 9 July 2026 | "reflected a strengthening El Niño" |
| 13 August 2026 | "reflected a strengthening El Niño" |
| 10 September 2026 | "reflected a strengthening El Niño" |
Six months, cool-leaning to strengthening El Niño. The last three rows are word for word identical, and that is the point: since July, CPC's diagnosis of the coupled system has not moved at all. The odds attached to it have.
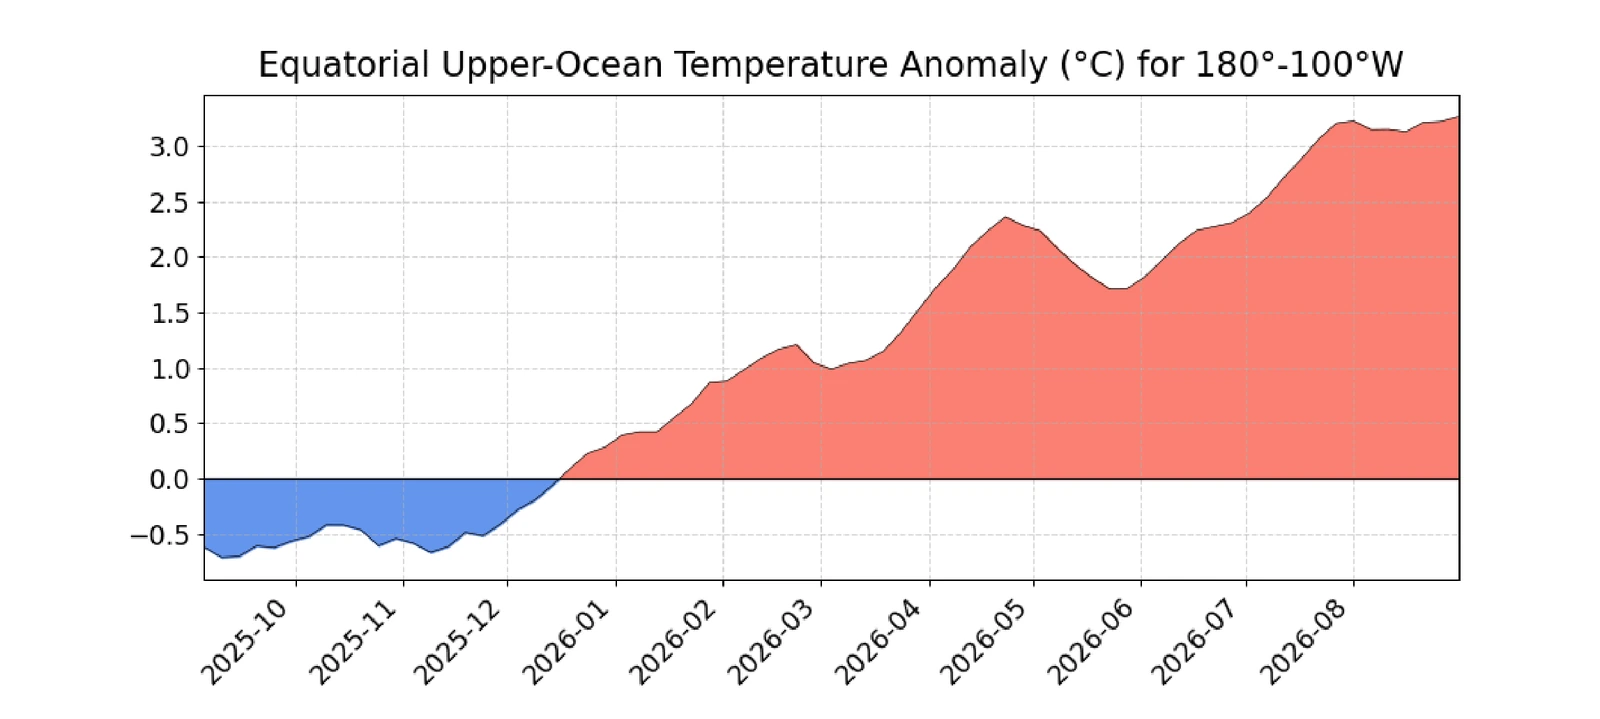
The ocean moved first. The volume of warm water stored in the equatorial Pacific, the fuel tank for any El Niño, went from below average in July 2025 to the highest single month in the entire record, which begins in 1980, by July 2026. It edged past April 1997, the previous top month. That is a genuinely enormous recharge, and it happened in about twelve months.
Then the atmosphere committed. Through spring, forecasters kept hedging, because a warm ocean alone doesn't make an El Niño. The atmosphere has to respond. CPC said as much on 14 May: "The strongest El Niño events in the historical record are characterized by significant ocean-atmosphere coupling through the summer, and it remains to be seen whether this occurs in 2026."
It occurred. Three independent atmospheric fingerprints flipped sign between March and July 2026:
- Trade winds collapsed. Low-level winds over the western Pacific didn't just weaken. They reversed to westerly, running about 2 standard deviations from normal. Over the central Pacific the anomaly hit −2.4σ.
- The storm belt moved. Outgoing longwave radiation near the Date Line, a proxy for deep convection, swung from +5.6 W/m² in March to −19.4 W/m² in July. Negative means more cloud, more storms. The thunderstorms relocated, right on cue.
- The pressure see-saw tipped hard. The Southern Oscillation Index went from +1.2 in March to −2.4 in July, the most negative reading of the sequence.
That's the difference between a warm patch of ocean and an actual El Niño. It's also what turned a hedged spring forecast into four months of escalation: a 63% chance of a very strong event in the 11 June discussion (for November–January), 81% on 9 July (October–December), then 95% on 13 August and 98% on 10 September for that same season, with a record priced in on top.
How Strong Is It, Really?
Here's where honesty matters, because there are two defensible answers depending on which index you pick, and picking the flattering one is how "biggest El Niño ever" headlines get made.
Compare like with like: every event measured at the same point in the calendar, June–July–August.
| Event | ONI | RONI | Peak RONI |
|---|---|---|---|
| 1982–83 | +0.78 | +0.89 | +2.40 |
| 1997–98 | +1.48 | +1.50 | +2.28 |
| 2015–16 | +1.44 | +1.27 | +2.25 |
| 2023–24 | +1.00 | +0.54 | +1.42 |
| 2026–27 | +1.80 | +1.36 | — |
(The first two columns are June–August values for each event. ONI is the legacy index; RONI is the one NOAA now classifies on. The last column is what each event eventually peaked at.)
On the old index, 2026 is running ahead of every historical analogue at this point in the year, 1997 included. On RONI, the index that actually classifies the event, it's ahead of 2015 and still behind 1997. That split is the whole argument for using the relative index: the legacy number says fastest start on record, the official one says second to 1997.
Both statements are true. The second one is the fair one.
Two more pieces of context worth holding onto:
- On the ocean-heat side, this event resembles 1997 more than 2015. The stored warm water in June 2026 was almost exactly the June 1997 value, and more than double anything the 2015–16 super El Niño ever managed. That's the fuel, not the fire, but it's a lot of fuel.
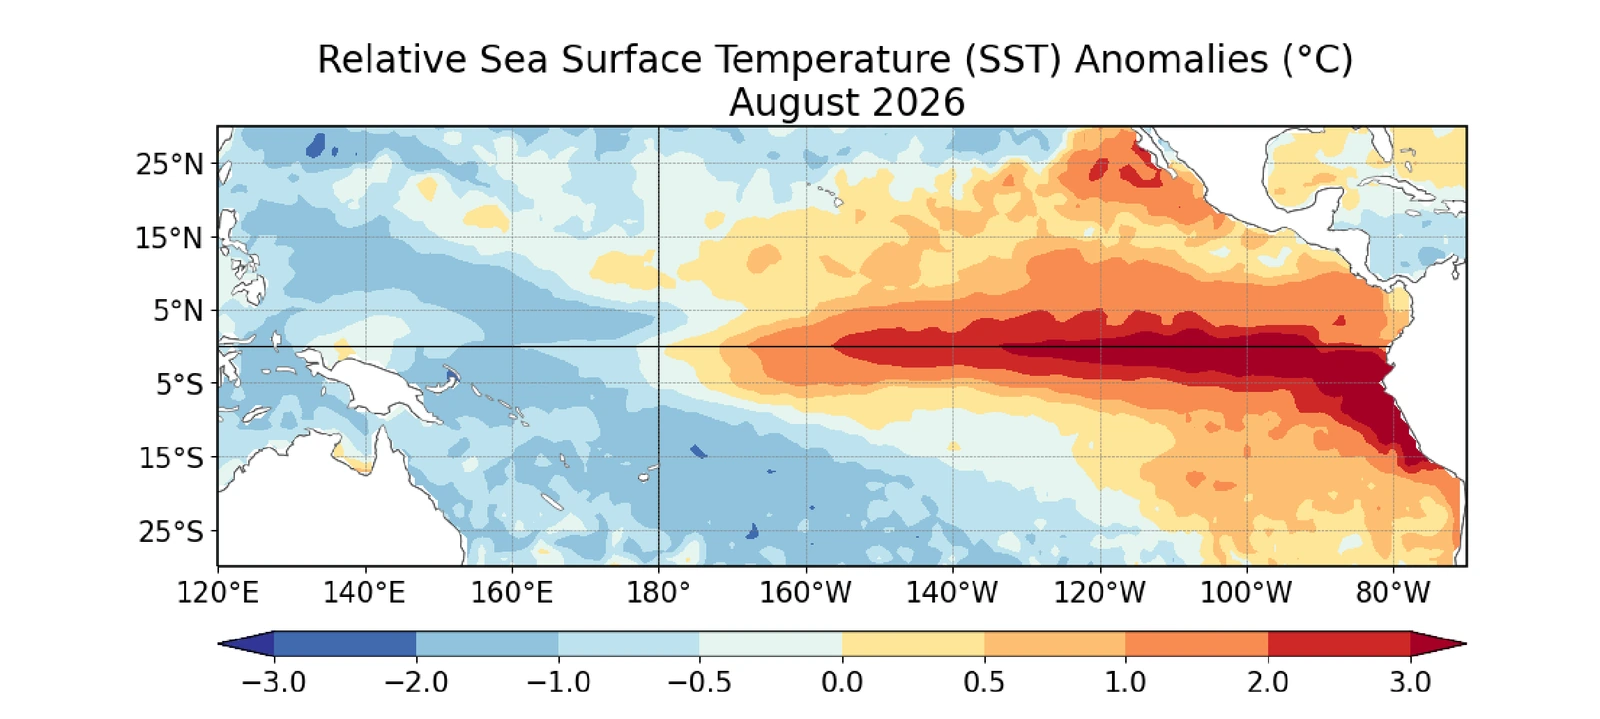
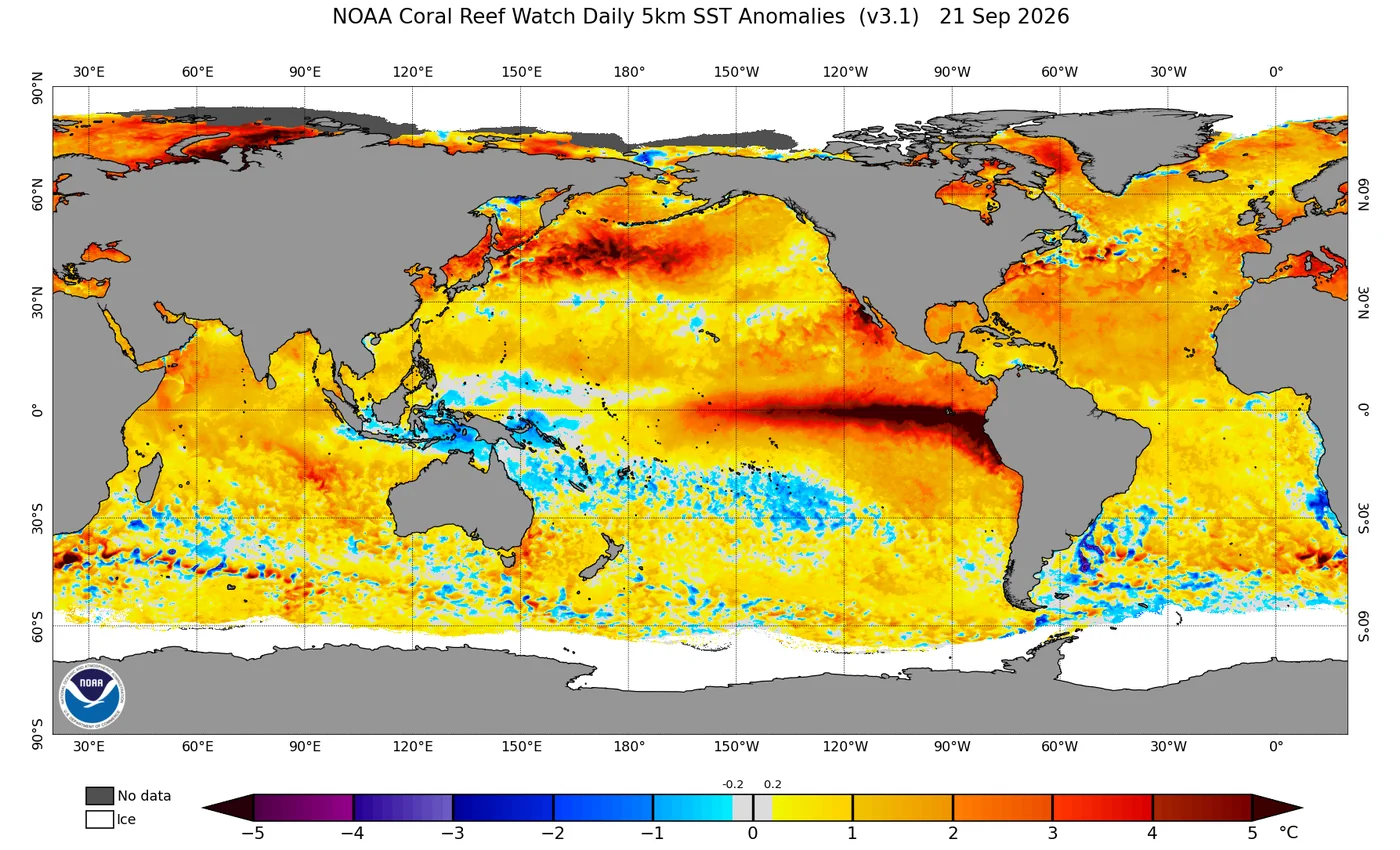
- The warmth is stacked toward South America. The far-eastern Niño 1+2 box reached +4.6 °C in the week centered 16 September, tying the +4.6 °C the box set two weeks earlier as the warmest single week anywhere in the record that begins in 1981. Every other week above +4.0 °C belongs to 1983, 1997 or this year. (CPC revises these weekly values retroactively, so treat the exact ordering as provisional. The company it keeps is the durable part.) Meanwhile Niño 4, way out west, sits at +1.0 °C absolute and 0.0 °C relative, meaning it's now running almost exactly even with the rest of the tropics. This is an east-Pacific-flavored event, and that shape matters for where the atmosphere responds.
For reference, the strongest events on record peaked at RONI +2.40 (1982–83), +2.28 (1997–98) and +2.25 (2015–16). The "very strong" threshold NOAA's probabilities are built around is +2.0. Today's value is +1.4. CPC has drawn a second line above all three of those historical peaks, at +2.5, and as of 10 September 2026 gives October–December a 75% chance of clearing it, up from 69% a month earlier.
What Forecasters Actually Expect
NOAA publishes two probability tables. The first is about whether El Niño exists at all, and it's about as emphatic as seasonal forecasting gets: 100% for every three-month season from August 2026 through March 2027, easing to 97% by February–April, 82% by March–May and 43% by April–June 2027. La Niña sits at 0% in every row but the last, where it finally registers 2%.
The second table is about how strong, and it's the more interesting one:
| Season | Strong | Very strong | Was, 13 Aug |
|---|---|---|---|
| Aug–Oct | 23% | 77% | 75% |
| Sep–Nov | 3% | 97% | 93% |
| Oct–Dec | 2% | 98% | 95% |
| Nov–Jan | 7% | 93% | 90% |
| Dec–Feb | 21% | 75% | 70% |
| Jan–Mar | 39% | 39% | 35% |
| Feb–Apr | 27% | 5% | 6% |
| Mar–May | 4% | 0% | 0% |
| Apr–Jun | 0% | 0% | not issued |
(Issued 10 September 2026, verified against RONI, with the 13 August issuance in the last column for comparison. Seasons run from August 2026 through June 2027. "Very strong" means at least +2.0 °C, and that is the highest published category: CPC's +2.5 °C record threshold sits inside it rather than beside it. Rows don't total 100%; the remainder sits in the moderate and weak categories.)
Read the shape, not just the peak. It holds at or above 90% for three straight seasons, September through January, then decays through late winter, and La Niña never gets above 2% anywhere in the window. Every official product stops in mid-2027, so anything you read about La Niña in late 2027 is somebody extrapolating.
Note how little moved. Every season from August–October through January–March gained two to five points, the shape is identical to August's, and the peak simply got a little sharper. This is a forecast being confirmed, not revised.
Independent guidance points the same way on timing. The international model plume run by Columbia's IRI has 23 of 26 models clearing +2.0 °C in October–December. The World Meteorological Organization's multi-model ensemble has it "peaking in November." ECMWF's seasonal model peaks it in December. Those aren't three disagreements. They're three ways of describing the same late-autumn peak.
One caveat on that IRI figure: it's measured on the traditional Niño 3.4 index, not RONI, so its +2.0 °C line is not the same line NOAA's 98% is drawn at. Treat it as corroborating the strengthening and the peak timing, not as a second vote on the "very strong" call.
CPC's own consolidated outlook now puts the median October–December relative Niño-3.4 value at +2.67 °C, inside a 5-to-95% range of +2.12 to +3.23 °C. The median barely moved from August's +2.66 °C, but the range tightened at both ends, from +1.95 to +3.37 °C. The low end matters most: a month ago the bottom of that 90% span sat just below the +2.0 °C "very strong" line, and now it sits above it. That is what a 98% call looks like from the distribution side. That distribution, not the binned strength table, is where the 75% record figure comes from: the published strength categories stop at +2.0 °C and have no +2.5 bin at all.
One caution about model output: some individual model members are showing peaks near +4 °C. Do not take those at face value. ECMWF says plainly that a single model "is typically overconfident, and the eventual outcome can sometimes lie outside the predicted range." The credible signal is the cluster, not the tail.
Hurricane Season: the First Real Consequence
This is where El Niño is already showing up in daily weather, and NOAA updated its outlook on 6 August 2026. That remains the current outlook; NOAA issues an initial Atlantic outlook in May and a single update in early August, so nothing has superseded it. One caveat on timing: it predates the ENSO escalation by a week and states its own input plainly, a 48% chance of a very strong El Niño during August–October. CPC has since raised that season twice, to 75% on 13 August and 77% on 10 September, so if anything the outlook's suppression assumption has firmed up rather than weakened.
El Niño suppresses Atlantic hurricanes through a straightforward mechanism: all those relocated Pacific thunderstorms strengthen upper-level winds over the Atlantic, which increases vertical wind shear, the change in wind with height. Shear tears developing storms apart before they can organize. NOAA's phrasing: "El Niño increases wind shear, which tends to prevent tropical storms from forming or from getting stronger once formed."
The statistical record behind that is unusually clean:
"All hurricane seasons coincident with strong (greater than or equal to 1.5 °C Niño 3.4) El Niño events since 1950 have featured below-normal seasonal activity."
NOAA's updated 2026 Atlantic outlook:
| Measure | 2026 outlook | 1991–2020 average |
|---|---|---|
| Chance of a below-normal season | 75% | — |
| Named storms | 7–13 | 14 |
| Hurricanes | 2–6 | 7 |
| Major hurricanes | 0–2 | 3 |
As of 10 September the Atlantic has produced five named storms and no hurricanes: Arthur in mid-June and Bertha in late July, both in the Gulf, then Cristobal near the Azores on 12 August, Dolly in the deep tropics on 27 August and Edouard in the Gulf on 31 August. Dolly lasted about a day and a half before falling apart into an open tropical wave. That's textbook: El Niño makes the deep tropics hostile, so what activity does happen tends to be short-lived, or displaced toward the Gulf and subtropics, closer to home. Put the count against NHC's own climatology and the gap is stark. In an average season the first hurricane forms by 11 August, the second by 26 August and the third by 7 September. This season is now past all three benchmark dates with none, in the stretch that is normally the busiest of the year. That is the suppression showing up in the observed record rather than just the forecast.
The Pacific gets the opposite treatment. NOAA's East Pacific outlook calls for 15–22 named storms, above average, and fourteen are already on the board with five hurricanes among them, Norbert being the most recent addition. Lowell rapidly intensified into a Category 5 on 2 September. The two basins are running the same El Niño in opposite directions.
A suppressed season is not a safe season. NOAA repeats this every year and it's worth repeating here: this is not a landfall forecast, and it only takes one storm. NWS Director Ken Graham made the point about Arthur, which never became a hurricane and still delivered record rainfall to parts of Louisiana. Edouard made it again in September: also never a hurricane, and its remnants were still dropping flooding rain west of Tyler, Texas three days after it formed. If you want the details on how the forecast cone works and what it doesn't show you, we've covered the cone of uncertainty and why storms intensify quickly separately.
What It Means for North American Winter
First, a clarification, because this is the part most likely to be oversold: CPC has not issued its 2026–27 Winter Outlook yet. That comes in mid-October. What exists today is CPC's long-lead seasonal discussion, issued 20 August 2026, which already reaches into winter, plus decades of El Niño composite climatology. Note the date: the seasonal outlooks run on the third Thursday, not the second, so the 20 August set is still the live one and is superseded on 17 September. Everything in this section therefore predates the 10 September ENSO update above. These sets are revised monthly and the winter picture has already moved once, so treat anything below as the current read rather than a settled forecast.
The mechanism is well established. During El Niño the Pacific jet stream strengthens and extends across the southern United States, while the polar jet retreats north into Canada. That favors a wetter southern tier and a milder northern tier.
Here is CPC's actual December–February outlook, from the set issued 20 August 2026 rather than a generic composite:
| Region | Temp | Precip |
|---|---|---|
| Pacific Northwest coast | Warmer | Equal chances |
| N. Rockies & N. High Plains | Warmer | Drier |
| Upper Midwest & Great Lakes | Warmer | Drier |
| Northeast | Warmer | Leaning wet |
| Ohio & Tennessee Valleys | Leaning warm | Equal chances |
| Southeast | Near normal | Wetter |
| Gulf Coast | Near normal | Wetter |
| Coastal California & S. Arizona | Equal chances | Wetter |
| Alaska | Warmer, mostly in the east | Drier |
That table changed noticeably on 20 August, and the reasons are worth knowing:
- The classic dry Northwest got pulled back off the coast. This is the single biggest revision. CPC found that the closest analogs to this event "were wet well north along the West Coast, even encroaching much of the southern half of the Pacific Northwest," so the dry tilt was "left off the coast and restricted to inland areas such as the Northern Rockies and Northern High Plains." If you live in Seattle or Portland, the textbook El Niño dry winter is not what CPC is forecasting this year.
- California's wet signal got stronger, and later. Probabilities were "increased significantly to above 50 percent across much of coastal California and adjacent areas of southern Arizona from DJF through FMA, peaking in coverage during JFM." CPC's reasoning is worth quoting: recent east-Pacific El Niños "have produced copious precipitation, especially in late winter, with 2024 and 1998 being among the wettest Februaries in the last 100 years for parts of California." Note the timing: late winter, not midwinter.
- The Southeast is the most confident wet signal on the map, exceeding 60% by November–January and holding through late winter, with the wet tilt running "along almost the entire East Coast."
- The Ohio and Tennessee Valleys get nothing. Both are equal chances, because the closest analogs "are not supportive of a robust dry signal" there. The Tennessee Valley leaned wet in the July set; that tilt is gone.
- Alaska flips mid-season. CPC forecasts "a rapid transition from a wetter pattern in SON to a drier pattern by DJF" across much of the mainland, with the warmth concentrating in the southeast of the state.
The through-line: CPC is leaning on analogs "tuned to the current Eastern Pacific orientation of this El Niño event," and an east-Pacific event does not distribute its impacts the way the textbook composite does. That is the same east-weighted structure the sea surface map at the top of this post shows, arriving downstream.
Two things that surprise people:
The classic "cool southern winter" may not show up. CPC deliberately forecast near-normal rather than below-normal temperatures across the southern tier, writing that El Niño's cooling tendency there "is often offset by above-average temperature trends, particularly over the Southeast." The composite map you've seen for thirty years is being partly cancelled by the warming trend.
Nobody is forecasting your snow total. CPC does not issue seasonal snowfall outlooks; that product doesn't exist. Any article giving you a winter snowfall number for a specific city is making it up. Snow depends on storm tracks and temperatures at the scale of individual systems, which is why even three-day snow forecasts vary so much. El Niño also isn't the only driver in play; a polar vortex disruption can overwhelm the seasonal signal for weeks at a time.
Around the World
The rainfall risk is spread across both hemispheres. WMO's seasonal update leans dry for southern and eastern Australia, the Indian subcontinent, Central America and the Caribbean, and northwestern South America, and wet for the central and eastern equatorial Pacific, the Greater Horn of Africa, southeastern South America, and western North America. Every one of those is a shift in the odds, not a forecast.
The global temperature story lands in 2027, not 2026. El Niño's peak effect on global average temperature arrives roughly three months after the Pacific peaks, and it has to work its way through the atmosphere after that. With this event peaking around November–December 2026, the imprint mostly falls in the following calendar year. WMO puts it plainly: El Niño events "exert their strongest influence on global temperatures during the year following their onset." Carbon Brief's July 2026 analysis gives 2026 about a 35% chance of being the warmest year on record, and 2027 about a 92% chance.
Coral reefs are the quiet casualty. The fourth global bleaching event began in 2023 and, in NOAA's assessment, likely ended in 2025. It hit roughly 84% of the world's reef area, the largest on record, well past the 68% of the 2014–17 event. The first, third and fourth global bleaching events all coincided with strong El Niño periods. A very strong event peaking in November–December 2026 places the southern-hemisphere bleaching season of early 2027 squarely in the risk window.
What This Forecast Does Not Tell You
Five things worth being clear about, because the gap between "strong El Niño" and "I know what my winter looks like" is wider than most coverage admits.
1. "Very strong" and "record" are two different lines, and CPC prices both. The ≥ +2.0 °C category is open-ended, so the 98% attached to it is the probability of clearing that line, not of setting a record. The record question has its own number: as of 10 September, a 75% chance that the October–December RONI comes in at +2.5 °C or more, which would clear the +2.40 peak of 1982–83, the highest value in the RONI record. Three things to hold onto. It is a probability, not a prediction, and one chance in four still says the 1982–83 mark survives. It applies to one three-month season, not to the event as a whole: the same forecast gives December–February a 75% chance of merely staying very strong. And it is drawn on RONI, the relative index. On the legacy ONI, +2.5 °C is not a record at all, because 2015–16 peaked at +2.59.
2. "Super El Niño" isn't a thing. WMO says so directly: "The term 'super El Niño' is not part of WMO's operational classification system and is therefore not used in official WMO products." There are four official tiers: weak, moderate, strong, very strong. CPC itself now reaches past the top tier with the word "historic," but it does so with a number attached: +2.5 °C on a three-month RONI. Extraordinary language with a threshold behind it is forecasting. Extraordinary language without one still tells you something about the page.
3. 100% doesn't mean certain. It means the probability rounds to 100. CPC notes that a 0% chance "is approximate and not exact."
4. A strong signal in the Pacific is not a strong impact where you live. CPC, 10 September 2026: "With an event of this magnitude, the chances of experiencing impacts consistent with El Niño are larger, though not guaranteed." Australia's Bureau of Meteorology says the same thing more bluntly: "A strong El Niño signal in the Niño 3.4 region does not necessarily mean strong impacts."
5. A seasonal outlook is a different object than a weather forecast. A composite "typical El Niño winter" map is an average over a small handful of past events, each with its own quirks. It shifts your odds over three months. It cannot tell you whether it will snow on a given Tuesday. That's what forecast models are for, and they only see about a week ahead.
One more honest note: because this event is now more likely than not to end up larger than anything in the modern record, there's genuine uncertainty about whether it behaves like the composite at all. CPC flagged this themselves in its August hurricane outlook: a record-scale event "could result in the circulation having impacts we have never observed."
Frequently Asked Questions
Is the 2026 El Niño the strongest ever?
Not yet, and the final rank won't be settled until winter, but as of 10 September 2026 a record is the single most likely outcome. On the relative index NOAA classifies events with, it stands at +1.4 °C for June–August 2026, against record peaks of +2.40 °C in 1982–83 and +2.28 °C in 1997–98. NOAA now gives October–December a 98% chance of reaching "very strong" (at least +2.0 °C) and a 75% chance of reaching +2.5 °C or more, which it describes as "a historic event that would exceed the strength of previous El Niño events dating back to 1950." CPC's consolidated outlook for that season has a median of +2.67 °C. Read the 75% for what it is: a probability covering one three-month season on one index, leaving a one-in-four chance the 1982–83 record stands.
When will El Niño peak?
Late autumn through early winter 2026. NOAA's strength probabilities peak in October–December, the WMO multi-model ensemble points to November, and ECMWF's seasonal model peaks it in December. Decay follows through late winter and early spring 2027, with NOAA giving a 97% chance El Niño conditions persist into February–April 2027 and 82% into March–May.
Why do different sources give different El Niño temperatures?
Because they use different time windows and different baselines. For the week centered 16 September 2026, the Niño 3.4 region read +3.0 °C as an absolute weekly departure and +2.1 °C as a relative one. Averaged over June–August 2026 instead, the same region read +1.8 °C on the traditional ONI and +1.4 °C on RONI. NOAA classifies El Niño on RONI, a three-month average that removes tropics-wide background warming and then rescales the result to the familiar ONI range. NOAA made it the official index on 1 February 2026. Weekly values are noisy; the three-month indices are what define an event.
Does El Niño mean fewer hurricanes?
In the Atlantic, usually yes. El Niño increases vertical wind shear over the Atlantic, which disrupts developing storms. Every hurricane season coinciding with a strong El Niño since 1950 has been below normal, and NOAA's 6 August 2026 outlook gives this season a 75% chance of below-normal activity. The Pacific runs the opposite way, with an above-average East Pacific season expected. But a below-normal season is not a safe season; landfall risk is not predicted by seasonal outlooks.
Will El Niño give me a warm winter?
It shifts the odds toward a milder winter across the northern United States and a wetter one across the southern tier, but it is not a guarantee for any location. The classic "cool southern winter" signal is being partly offset by long-term warming, and CPC has forecast near-normal rather than below-normal temperatures for the southern tier this year. Other drivers, including polar vortex disruptions, can override the El Niño signal for weeks at a time.
Does El Niño cause record global temperatures?
It contributes to them, with a lag. El Niño releases stored ocean heat to the atmosphere, and the peak effect on global average temperature arrives in the calendar year after the event develops. The 2023–24 El Niño contributed to 2024 becoming the warmest year on record. For the current event, that means 2027 is the year to watch. Carbon Brief's analysis gives 2027 about a 92% chance of setting a record, versus about 35% for 2026.
Track the Pacific With WeatherAI
El Niño works on the scale of seasons. Your actual weather still arrives one day at a time, and that's where WeatherAI lives, on your iPhone:
- Ask in plain English. "Is this storm track normal for El Niño?" gets you a real answer for your actual location, not a composite map.
- Hurricane tracking with live positions and official NHC forecast cones for Atlantic and Pacific storms, useful in a season where the risk shifts toward the Gulf.
- Professional-grade radar for when the seasonal outlook stops being useful and the storm is actually overhead.
- Custom alerts so you hear about the rainfall event that matters to you, not the one making national news.
Seasonal outlooks tell you how to bet. They don't tell you what to do on Thursday. Get both.
Download WeatherAI for iPhone →
Sources. Every figure above traces to one of these:
- NOAA CPC ENSO Diagnostic Discussion, 10 September 2026: advisory status, the greater-than-90% synopsis, the 75% record call and the +2.5 °C RONI threshold, and the August index values. Dated archive: enso_disc_sep2026 (the live page is overwritten each month)
- CPC ENSO Diagnostic Discussions of 13 August, 9 July and 11 June 2026: the 95%, 69%, 81% and 63% figures and the July wording quoted above
- CPC ENSO probabilities, strength probabilities and RONI outlook, all issued September 2026: the three tables, the strength-category thresholds and the October–December distribution. The August comparison column comes from CPC's archived strength chart for that issuance
- CPC RONI and ONI series, read 10 September 2026: the June–August values, the event comparison table, all historical peaks, and the 2023–24 comparison. June–August is still the last complete season; July–September posts in early October
- CPC weekly absolute and relative SST indices, read 22 September 2026: the +3.0 / +2.1 weekly pair, the regions diagram and the Niño 1+2 ranking. CPC revises these files retroactively, so weekly values here are as published on that date
- NWS Public Information Statement 26-05, 13 January 2026: the ONI-to-RONI switch and RONI's definition, including the variance rescaling
- CPC Long-Lead Seasonal Outlook discussion, 20 August 2026, plus the official Dec–Feb temperature and Dec–Feb precipitation maps: every winter claim. Note the lead number shifts each month as the seasons roll forward; Dec–Feb 2026-27 still sits at lead04, confirmed against the "Valid" line printed on the maps on 10 September 2026. This outlook is superseded on 17 September 2026
- NOAA 2026 Atlantic Hurricane Season Outlook update, 6 August 2026: the seasonal outlook ranges and the 75% below-normal figure
- NHC 2026 tropical cyclone archive and seasonal climatology, read 10 September 2026: the storm counts, formation dates and intensities in both basins, and the 11 August, 26 August and 7 September benchmark dates for the first three Atlantic hurricanes of an average season
- NOAA PMEL Warm Water Volume, read 10 September 2026: ocean heat content, the record-high July 2026 month and the 1997 and 2015 comparisons. The series runs from January 1980 and stops at July 2026 as of this reading
- CPC monthly index files for the atmospheric numbers: SOI, outgoing longwave radiation, and 850 hPa trade winds for the west and central Pacific
- Carbon Brief State of the Climate, 24 July 2026: the 35% and 92% record-year projections, which are Carbon Brief's own estimates rather than an agency forecast
- IRI/Columbia ENSO forecast, July 2026 · WMO Global Seasonal Climate Update, prepared 20 July 2026 · Australian BOM · ECMWF on relative Niño indices · NOAA Coral Reef Watch
Keep reading: what the hurricane cone actually shows, why the polar vortex matters in winter, and how weather models differ.
Keep Reading
These articles cover adjacent weather questions, practical explainers, and planning workflows related to this topic.
Weather Education
What Is the Polar Vortex? Understanding Extreme Winter Cold
Learn what the polar vortex is, how it affects winter weather across North America, why it sometimes 'breaks down' to deliver extreme cold, and what to expect during polar vortex events.
Weather Education
Ice Storm vs Freezing Rain vs Sleet: What's the Difference?
Learn the key differences between ice storms, freezing rain, and sleet. Understand how each forms, what they look like, and how to stay safe during winter precipitation events.
Weather Education
Understanding Snow Totals: Why Forecasts Vary
Learn why snow forecasts give ranges instead of exact numbers. Understand snow ratios, banding, elevation effects, and how to interpret winter storm predictions.
Useful Next Stops
Jump from the explainer into tools, feature pages, and seasonal hubs that deepen the topic.
Guide
GFS vs HRRR vs NAM
Learn which forecast model to trust for different situations and how to interpret model data.
Live Tracker
Live Hurricane Tracker
Follow every active Atlantic and Pacific storm with the official NHC cone of uncertainty and forecast track, refreshed continuously.
Guide
The Hurricane Cone of Uncertainty
What the cone really means, why impacts reach far outside it, and how to read spaghetti models.
Glossary
Cyclone
A rotating low-pressure weather system.